
By Dan Goetz – Syracuse University ’20
Abstract
The MLB draft spans 40 rounds and most of the people drafted will never get a chance to play in the major leagues. But for the few that do, how do they do it? Is there something that makes them special or something innate that makes teams overlook them? .
In this research, I tested a various amount of variables that might contribute to Major League Baseball Success. This includes socioeconomic factors such as median income and the racial profile of the city that these players grew up in. It also includes the statistics from players college and minor league experience.
Most of the data for this research was obtained through baseballreference.com. This includes regular statistics as well as the background information that I used in my research. The collegiate stats were taken from baseballcube.com. In addition to the metrics that I got from these sources; I also created my own metrics using formulas from fangraphs.com
Introduction
The overall goal of my research was to determine if athletes, specifically baseball players have some innate quality that leads them to become more successful than others. This could be due to their background growing up or just some quality like having a good hand-eye coordination. In my preliminary research, I found that the best way to do this is to tackle my questions at two different angles. The first angle was to look at the players background growing up. I wanted to answer the two following questions:
1) Do players in wealthier areas get picked earlier in the draft because they have the recognition from a young age?2) Are players in poorer areas more likely to outplay their expectations because they are overlooked when they are younger?
I collected a sample data from every player drafted from 1998-2011 and classified them as either a steal, bust, or neutral . I quantified a player as a steal if they were drafted in the fourth round or later and made it to at least the double A level . I quantified a player as a bust if they were a first or second round pick that either did not make the majors or accumulated a bWAR (Wins Above Replacement Level) of 0 or less during their career. This gave me a sample data of 2436 Players.
The second angle that I looked at was their statistics. The goal of this was to test the theory that players who have plate discipline and strikeout less are more successful when they get to the major leagues. With the advent of StatCast, it has become easier to evaluate advanced statistics for big-league level players like launch-angle and exit velocity. However, this data is not yet available for college and lower level minor leagues.
During my research, I ran a series of seven models which were used to predict success of a player based on a variety of factors. The first three models that I looked at were used based on physiological factors such as state, average income, racial profile, and whether or not they went to college. My next two models hoped to find a metric that MLB teams are overlooking. For the data in these models, I used all of the players that were quantified as steals or busts in the previous models. The last two models that I ran were the same two models are before, except I filtered out the minor league data, which left just the college data. This gave me the opportunity to see find out what to look for when drafted a college player. It also gives me a chance to test the theory that college players are betting disciplined hitters at the plate.
Models
Logistical Model 1 :
2436 Players
Independent Variable: Median Income, Median Income Squared, Position Dummies, Team Dummies Height, and Weight, TownPercentageWhite
Dependent Variable: “Steal or Bust” Steal=1, Bust=0
Ordinary Least Squares Model 2 and 3:
Model 2: 853 Steals
Model 3: 1584 Busts
Separated into Steals and Busts and ran two different models
Independent Variables: Median Income, Median Income Squared, Position Dummies, TownPercentageWhite
Dependent Variable: Pick
Model 4: Hitters Stats Regression Logistic Model (All Levels)
1151 Players
Independent Variable: College/HS, Home Run Percentage, Walk Percentage, Strikeout Percentage, Stolen Base, Isolated Power, Team Dummies, Height, and Weight, WRC, wOBA
Dependent Variable: “Steal or Bust” Steal=1, Bust=0
Model 5: Pitcher Stats Logit Model (All Levels)
1286 Players
Independent Variable: College/HS, WHIP, BB/9, SO/9, Height, Weight, FIP,IP
Dependent Variable: “Steal or Bust” Steal=1, Bust=0
Model 6: College Hitting Stats Logit Model
145 players
Independent Variable: Organization Dummies, Height, Weight, SB, BB PCT, HR PCT, SO PCT, ISO, WRC, wOBA
Dependent Variable: “Steal or Bust” Steal=1, Bust=0
Model 7: College Pitching Logit Model
103 players
Independent Variable: BB/9, SO/9, Height Weight, WHIP, FIP, IP, Organization Dummies
Dependent Variable: “Steal or Bust” Steal=1, Bust=0
Results
Model 1: The main point of model one was to prove that living in a poorer area growing up leads to people being overlooked in the draft. . It actually turned out that more players from wealthier areas turn out to become steals than players in poorer areas. . This maybe be attributed to the fact that people from wealthier areas have the money to train in the offseason, and not have to worry about getting other jobs.
Model 2: Implies that for steals, players who come from higher income areas are a lot more likely to be picked earlier in the draft than players who come from lower income areas.
Model 3: Implies that for busts, players in higher income areas and areas with a high percentage of Caucasian people are actually selected later.
Model 4: Players who went to college were more likely to be steals than players who didn’t.. This implied that lighter weight individuals tend to be more likely to be steals. . Plate discipline is a skill that only a few hitters have, and teams should look for that instead of the potential to hit a lot of home runs. Power does not seem to matter.
Model 5: Pitchers who limit the baserunners on the base paths at the lower levels seem to fare better at the professional levels. It takes an advanced skill set to have quality pitches and to throw strike consistently.
Model 6: Teams are selecting guys with high stolen bases totals from college and they are not panning out in the professional leagues. Teams need to do a better job taking shorter players out of high school
Model 7: Pitchers who give up a lot of runs in college should have a chance to be selected higher in the draft. FIP (Fielding Independent Pitching) was a far better predictor of MLB success than ERA (Earned Run Average), which attempts to account for fielder. Teams also seem to overdraft based on strikeout numbers when they should be looking at strikeout/walk ratio.
The table below gives an example of the results of model 1, further illustrating that Median Income has an impact on whether the player becomes a steal or a bust.
| Variable | Coefficient | p-value | Significance |
| Intercept | 0.0097 | 0.9653 | |
| Median Income | 0.0056 | 0.0458 | ** |
| Median Income Spread | 0.0000 | 0.0890 | * |
| Percent Caucasian | 0.1015 | 0.0018 | *** |
| Weight | -0.0047 | 0.1462 | |
| Height | 0.0001 | 0.8466 | |
| College/HS | 0.00933 | 0.2493 |
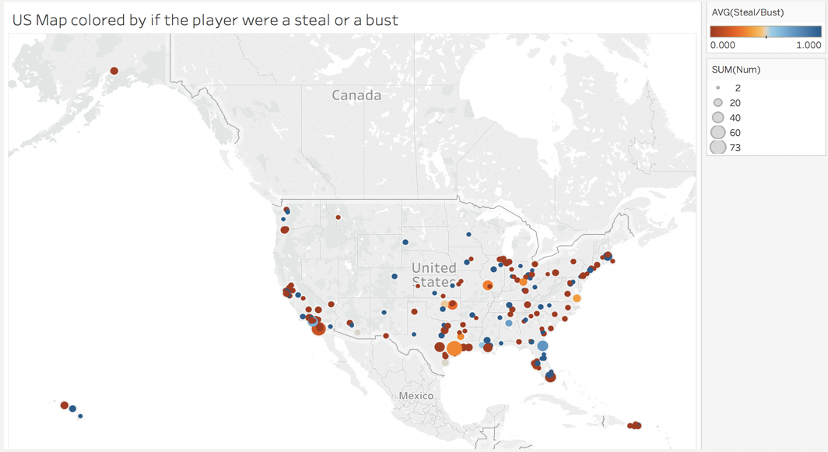
The above map shows where the players in the MLB draft are coming from. Most of players are from the eastern part of the country, especially in places such as Florida, Indiana, Ohio and Massachusetts. Texas and California. The most interesting thing about this map is that is shows that most of steals are in places that teams do not really scout. For example, in the middle part of the country like Colorado, Nebraska, Minnesota, and Iowa there were more steals that busts.
Discussion
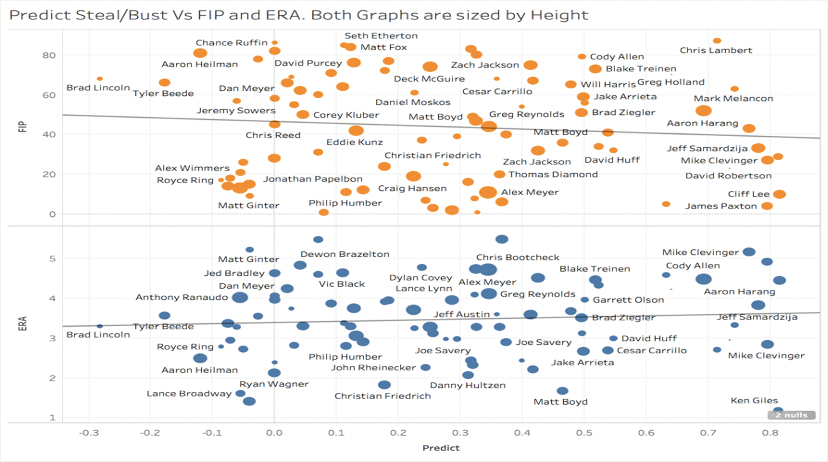
One of the most interesting things about the results of this research is the results of the first three models. The first model illustrated the players in wealthier areas who are picked later in the draft are actually more likely to become steals than players in poorer areas. This maybe be attributed to the fact that people from wealthier areas have the money to train in the offseason, and not have to worry about getting other jobs. There have been multiple stories about minor league players’ salaries and this result maybe a biproduct of their salaries being too low. Although the results of the first model were different from my hypothesized result, the second and third models went as expected. Players who come from higher income areas are a lot more likely to be picked earlier in the draft than players who come from lower income areas. As for the statistics models, the hittersmodels showed two major things. First, power does not matter,. Second, limiting strikeouts and walk rate are important. Strikeouts is an interesting topic because the current trend in baseball is that strikeouts are okay if you have a lot of power. My models seems to contradict that argument. Finally, for pitchers, teams have to be wary of luck when evaluating. As shown in the visualization below, . The graph on the bottom shows the relationship between ERA and predict for college pitchers. It actually trended up which that teams were overlooking some guys with clear potential but struggled a little bit in college. However, baseball is a game of luck and some pitchers may have benefitted from fielding or other factors. When you use FIP however, there is a downward trend, suggesting that teams should look for potential instead of runs allowed.
Conclusions
• Players who have money and are selected later in the draft are more likely to become successful than players who come from poorer neighborhoods.
• Teams are more likely to take chance on players later in the draft if they come from wealthier neighborhoods.
• However, in the first two rounds, teams draft on potential and do not really look at socioeconomic status.
• Hitters that have good plate discipline and are lighter weight are more likely to become steals than heavier power hitters.
• Pitchers who throw strikes and limit walks at the lower levels are more successful when they get to the big leagues.
• Teams overlook shorter players from college and tend to overdraft so called speed players from college
• Teams need to consider luck when evaluating pitchers as teams are drafting based on runs allowed and strikeouts instead of potential
References
News, Gameday. The Biggest Draft Day Steals in MLB History. 14 June 2019, http://www.gamedaynews.com/baseball/biggest-draft-day-steals-mlb-history/?view-all&chrome=1&safari=1. Accessed 20 Nov. 2019.
Bernstein, Dan. “MLB Draft 2019: Late-Round Steals of the 2000s Offer Glimpse into Scouting Process.” Sportingnews.com, 3 June 2019, https://www.sportingnews.com/us/mlb/news/mlb-draft-2019-late-round-steals-of-the-2000-offer-glimpse-into-scouting-process/sxxz3fm1kxe91p4pnswt1pdpa.
Caporale, Tony, and Trevor C. Collier. “Scouts versus Stats: the Impact of Moneyball on the Major League Baseball Draft.” Taylor & Francis, 5 Apr. 2012, https://www.tandfonline.com/doi/abs/10.1080/00036846.2011.641933.
Sannes, Jim. “Are Collegiate MLB Draft Prospects Better than High School Ones?” NumberFire, 6 June 2014.