
By Kyle Liotta – Syracuse University ’20
Abstract
Over the past decade, Major League Soccer (MLS) has been rising in popularity. This has led to the league rapidly expanding over that time frame, going from 16 teams in 2010 to 30 teams by 2022. This study is designed to look at the concept of expansion in the MLS and determine which cities are good candidates to have a future MLS franchise through regression analysis. The results will give an idea of how each of the 6 new expansion teams will fare in their first season in the MLS.
Introduction
For decades, the United States has attempted to grow the game of soccer. The first attempt at doing this was with the creation of the North American Soccer League (NASL) back in 1968. The league was fairly successful, peaking at 24 teams averaging an attendance of around 14,400 in the 1980 season. The league ended up folding following the 1984 season, and there were no major professional soccer leagues for the next decade. After months of planning, Major League Soccer (MLS) was formed in 1996. The inaugural season began with 10 teams playing and the league averaging over 17,000 fans a game. Over the next few years, the MLS would decline in average attendance, bottoming out at less than 14,000 fans per game in 2000. However, over these first five years two important events occurred. First, the MLS had its first expansion, going from 10 teams to 12 teams. With the first expansion, the MLS selected the cities of Chicago and Miami. While Chicago was successful – averaging over 17,000 in their inaugural season – Miami was not as they folded the club after just 4 seasons. Over the years since Miami folded, only one team has folded and several teams have flourished in the MLS. Second, the Columbus Crew opened the MLS’s first soccer-specific stadium. This was a major turning point in American soccer. For the first several years of the MLS, clubs have been playing their games in professional football stadiums or college football stadiums, which have capacities that are way too large for a league that is still trying to find its footing. Of the 24 teams that played in the MLS in 2019, 18 played their home games in a soccer-specific stadium.
While the MLS finished the 2019 season with 24 teams, the league plans to expand to 30 teams by the end of the 2022 season. The 30th team is the most important because the MLS believes that they can establish themselves alongside the North American “Big 4” sports.
Methods
To predict the success of expansion in Major League Soccer, I wanted to run two different tests. The first being if the top 50 cities in the United States look like a city that currently has an MLS franchise. To achieve this, I created a logit regression model. The dependent model for the logit model is if the city has an MLS franchise that played in the 2019 season. The independent variables are: the population of the city, the population of the city squared, median age of the city, the percentage of males living in the city, the median household income, the racial profile of the city, and the number of sports teams that play in the MLB, NFL, NHL, or NBA in the city. After seeing which cities fit the mold of a current MLS city, I then created an attendance model for the last ten seasons of the MLS.
For my attendance model, I decided to exclude the cities of Atlanta and Seattle, two extreme outliers when it comes to attendance in the MLS. Both Atlanta and Seattle average over 40,000 spectators a game even though they are playing in NFL stadiums. The variable selection that I have chosen for my OLS model is population, population squared, median age, median household income, racial profile of the city, the number of sports teams in the city, age of stadium, and a binary variable to determine if a stadium is soccer-specific. For the age of the stadium, I decided to cap it at 20 years due to the large outliers that I had. For example, FC Cincinnati played their 2019 home games in Nippert Stadium, which was built in 1915. The stadium has been renovated several times since, but the age of the stadium would be 60 years older than any other stadium in my data set.
Results
After running my logit model, I used the predict() function in R to get my predicted probabilities that a city in the U.S. looks like a city that has an MLS franchise based on its demographics. Below are the top 5 cities in the United States, that are close to being MLS cities, without currently having an MLS franchise:
| City | Predicted Probability | Future Expansion? |
| Charlotte, North Carolina | 0.70 | Yes |
| Phoenix, Arizona | 0.57 | No |
| San Francisco, California | 0.53 | No |
| Nashville, Tennessee | 0.50 | Yes |
| Austin, Texas | 0.49 | Yes |
One reason why these cities are successful is because all five of these cities are at, or above, the U.S. median household income of $59,000. Another reason why these cities are among the highest for looking like an MLS city, is because they have other sports teams that also play in the city. Besides Austin, all of these cities have at least two other professional sports franchises that play in the same city. This correlation is simply due to the fact that every single team in the MLS plays in a city with at least one other sports franchise in it. Finally, all of these cities are fairly young cities based on their median ages, with the exception of San Francisco. Other than being fairly older than the other four cities on the list, San Francisco also had the highest percentage of Asians living in its city, which helped drive down their predicted probability number. The linear model is used to determine the average attendances of each team that played a season in the MLS between the years 2010 and 2019. This resulted in 161 observations across ten years of city demographic data. I decided to remove Atlanta and Seattle from my data set because they are extreme outliers when it comes to attendance. This dropped the number of observations from 161 to 148. The model returned a lot of telling things about the demographic audience of the MLS. The first being that Hispanic and black fans are driving attendance numbers up, while Asian fans are driving attendance downwards. This can also be seen with the negative coefficient of median household income, as Hispanic and black people tend to be lower income households. The age of the stadium variable and the age of stadium squared variable show that a quadratic relationship exists between that and attendance.
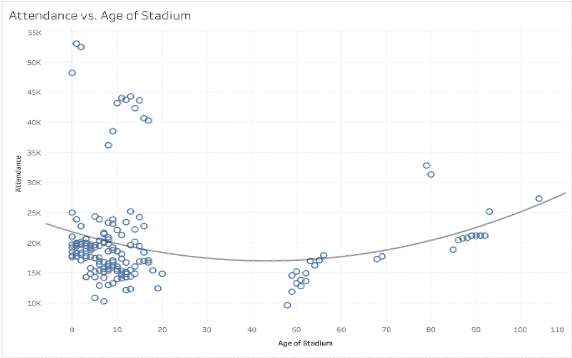
As observed in the graph, the newer stadiums are expected to bring a higher attendance, as well as stadiums that are over 70 years old. The reason why the newer stadiums are receiving higher attendance numbers is because of the “honeymoon effect” which is present in every professional sports league in the United States. If a team opens a new stadium, they are going to receive a small boost in attendance due to people wanting to come to see the new stadium. The reason why older stadiums are also receiving more attendance is because of the historical factor. Stadiums that are over 75 years old have a historical presence that people want to see.
Conclusions
The MLS has been rapidly rising in popularity over the past ten years, so it is no secret why they want to expand as rapidly as they have been over the next few seasons. I wanted to cover multiple objectives in this piece. The first being if a city in the U.S. looks like a current MLS city. The second being to predict attendance for the top 50 cities in the U.S. The results for my first objective were pretty straightforward. For a city to look like an MLS city, it needs to have a high population with an above average median household income, and be a relatively younger city. The results for my second objective showed that each of the six expansion cities that the MLS chose are in a good position to be successful when it comes to their inaugural season in the MLS. The cities that were projected to have better attendance were cities that had higher percentage of minorities, higher total populations, and a smaller amount of other professional sports teams in the city. The MLS has chosen great expansion cities in the past and it looks like they have chosen great cities for the next wave of expansion.
There is plenty of room for future research on this topic including improvement to the models that I have built for this paper. To improve my research, there are other variables that can be included in the linear model, such as team winning percentage and creating a “Star Player” variable. The purpose of this research was to determine which cities could be sufficient enough to host MLS franchises and to see what a team’s attendance would be if they did have an MLS team.
References
- Rascher, Daniel A., Matthew J. Baehr, Jason Wolfe, and Steven Frohwerk. “An Analysis of Expansion and Relocation Sites for Major League Soccer.” International Journal of Sport Management
- Gómez-González, Carlos, Jorge García-Unanue, Javier Sánchez-Sánchez, Esther Ubago Guisado and Julio del Corral. “Evidence on soccer-specific stadiums and attendance: The Major League Soccer case.” Revista de Psicología del Deporte (Journal of Sport Psychology)
- Deschriver, Timothy D., Daniel A. Rascher, and Stephen L. Shapiro. “If We Build It, Will They Come? Examining the Effect of Expansion Teams and Soccer-Specific Stadiums on Major League Soccer Attendance.” Sport, Business and Management: An International Journal
Acknowledgements
I would like to thank Dr. Rodney Paul and Dr. Jeremy Losak for their guidance in helping me with this research. My special thanks are extended to Falk College and Syracuse University for giving me the opportunity to complete my own research and allow me to share my research with so many. Finally, I would like to thank my parents for all that they have done throughout my academic career. I would not be where I am today without their support and encouragement along the way.