
By Stephen McClain – Syracuse University ’20
Abstract
In the research articles that I was examining a major topic about injuries was missing. The focus of the articles was that more and more pitchers were getting injured from throwing at a higher velocity or because they were throwing off speed pitches like the curveball with incredibly spin rate. In modern MLB, a high velocity and high spin rate are keys to even making it to the majors in the first place as well as being an effective pitcher. The other side of the articles looked at the impact of an injury when a pitcher returned to play but they just looked at traditional stats. This led me to want to investigate into looking at Statcast data to dive deeper into the impact of the injuries.
Introduction
When I first started researching for my thesis I wanted to ask a question about pickoff attempts. After reading what felt like every possible article about the topic of pickoff attempts two major concepts came up. The first concept was examining the impact of pickoff attempts on baserunning and the second concept was all about fatigue or possible injuries. The more I investigated into the more I got intrigued. I moved away from looking at pickoff attempts and started looking into pitching injuries. Fortunately I had already planned to examine Statcast data so the data was already. Next came the thought of what I what to look into. There are numerous amount of articles about what leads to a pitcher getting injured like high velocity pitchers and Tommy John surgery, so I decided to take it in a little different direction. Instead I wanted to explore the effects of an injury or injuries on a pitcher when the pitcher returned to play.
Method
The 13 factors that I used are listed and defined below:
Release pos x: The horizontal release position of the ball measured in feet from the catcher’s perspective.
Release pos z: The vertical release position of the ball measured in feet from the catcher’s perspective.
Release pos y: The release position of the ball measured in feet from the catcher’s perspective.
Effective Speed: The speed of the pitch as it would be perceived to the hitter (example: the pitch was measured at 83 mph but to the batter it looked like 86 mph).
Pitch Number: Total number of pitches during the plate appearance.
Release Spin Rate: Spin rate of pitch tracked by Statcast.
Balls: Pre-pitch number of balls in the count.
Strikes: Pre-pitch number of strikes in the count.
Outs When Up: Pre-pitch number of outs.
Launch Speed: Exit velocity of the batted ball as tracked by Statcast.
On 1B: Pre-pitch MLB Player Id of Runner on 1B.
On 2B: Pre-pitch MLB Player Id of Runner on 2B.
On 3B: Pre-pitch MLB Player Id of Runner on 3B.
Model Section: For my model I used a logit regression model because the dependent variable that I used in my data are all binary variables meaning that they are all the independent variables are measured in ones and zeros. The logit regression model can compare the binary dependent variable relationship with the independent variables which are not binary. The dependent variables in the different models specified are whether they were injured or not, injured more than once, and injured the same area more than once and the location of the injury, the elbow, leg (including hip), arm (labeled bicep_wrist_forearm_fingers), shoulder, upper body including the back and other. The 13 factors are also listed and defined above.
Results
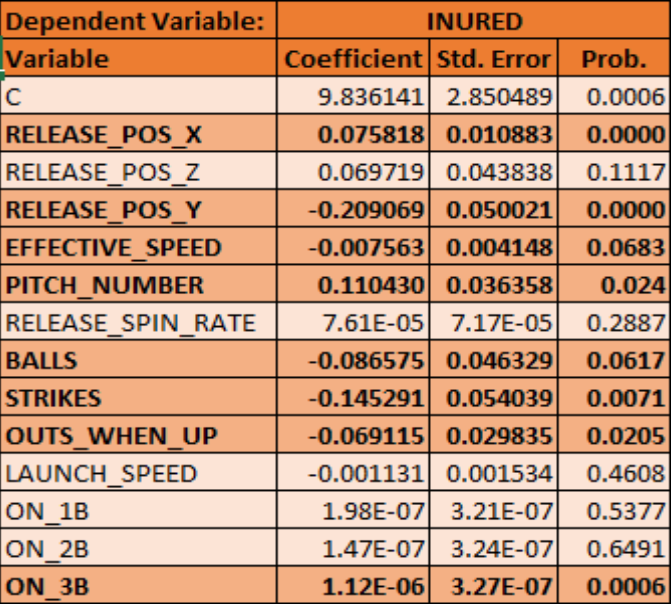
According to the graph above, the variables highlighted in bold are considered significant. This means that they have a confidence interval above 90% meaning that we are 90% or above confident that this will occur. The plot below shows that when a pitcher returns from an injury a right-handed pitcher’s horizontal release point will be closer to their body while an injury to a left-handed pitcher will have a horizontal release point that is farther away from their body. In the graph below is the release point of a right-handed pitcher. The farther left the dot is means that the pitcher in this case is releasing the ball further from their body.
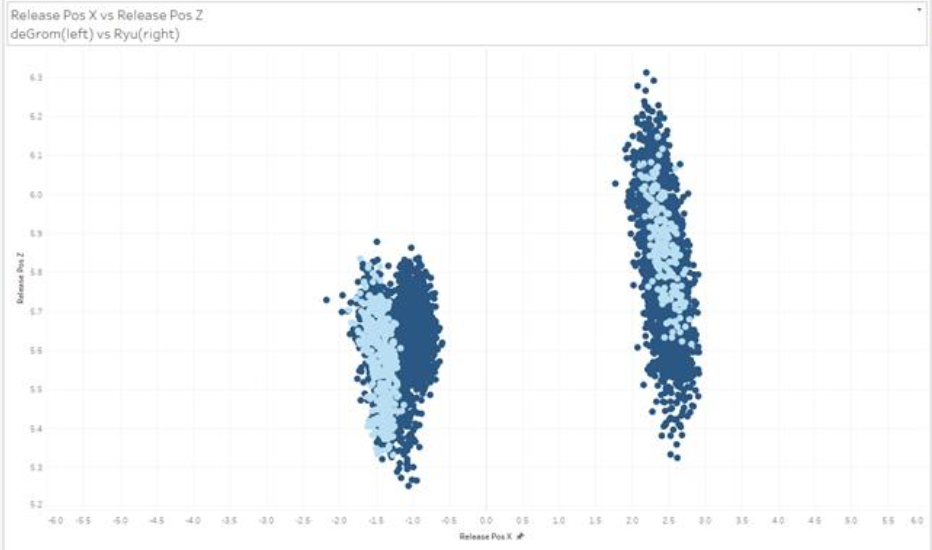
I wanted to look at some of the best pitchers in baseball to see if they followed the same trend. Fortunately, I say fortunately for me data wise but not for the fans of their franchise deGrom is on the left side of the graph, again this is from the catcher’s perspective so a right handed pitcher will appear on the left side of the graph, he tends to follow the same trend as what the regression shows. Ryu, like every pitcher that I have graphed, shows variance in his release point but does not follow the regression.
Conclusions
By using a logit model it aloud for the value of an injury to be either a 1 or a 0 or yes and no. The data was then organized into eight different categories with a total of 13 factors that were chosen from a list of 89. When returning from an injury in general not only should a coaching staff watch out for a change in release point, but they should also look for loss of control with a decrease in strikes and an increase in pitch number. Focusing on the pitcher’s release point to back to where it was before the injury could be key to getting back to form. The most important thing about a pitcher returning from an injury is to make sure that they are 100% before hitting the mound.
References
Schwartz, Gil, and Jason Martinez. “MLB Injury Report 2019.” RosterResource.com, www.rosterresource.com/mlb-injury- report/.
“Statcast Search CSV Documentation.” Baseballsavant.com, baseballsavant.mlb.com/csv-docs.