By Zach Anhalt – Syracuse University ’21
Introduction
The legalization of sport gambling in various states across the country is paving the way for sport gambling innovation. Player Props are a rather new type of sports wager that allows gamblers to bet on the box score performance of various individual athletes. And with increasing popularity and opportunity for sport gamblers, live betting has become another poplar trend, which is wagering taken place during a live sporting event.
My project aims to add another sports wagering opportunity that both incorporates Player Props and live betting. My senior thesis is using a variety of datasets to build a series of complex live player prop models that hypothetically would be used to gamble on for sport gamblers. My player prop models would be used to accurately predict final box score statistics of individual NFL skill position players based on in-game conditions and performance. Each individual model will represent a singular Player Prop prediction for a given time interval.
Time intervals were structured to give sport gamblers opportunities to wager on Player Props at specific times during the game. My time intervals are structed where a live Player Prop wager is available to bet on for every 7.5 minutes of an NFL game. Knowing an NFL game is a full 60 minutes long, my live Player Props would be available to bet on at seven different times during the game
My project aims to discover relationships between variables and uncover the truth behind preconceived notions surrounding Player Prop wagers. I have a genuine curiosity on what truly influences player performance during live games, and through my analysis I aim to identify how influential each variable is in my models.
Data Summary
To create accurate Player Prop models, I needed to gather data from multiple sources. Thanks to EV Analytics and their Chief Executive Officer, Derek Fischbach, I was able to obtain my initial dataset that included pregame Player Prop projections for skill position NFL players from the 2017 season through the 2019 season. I then merged this data with interval-based box score statistics that were scraped from pro-football- reference.com. Below are summary statistics for the box score statistics, specifically the yardage statistics.
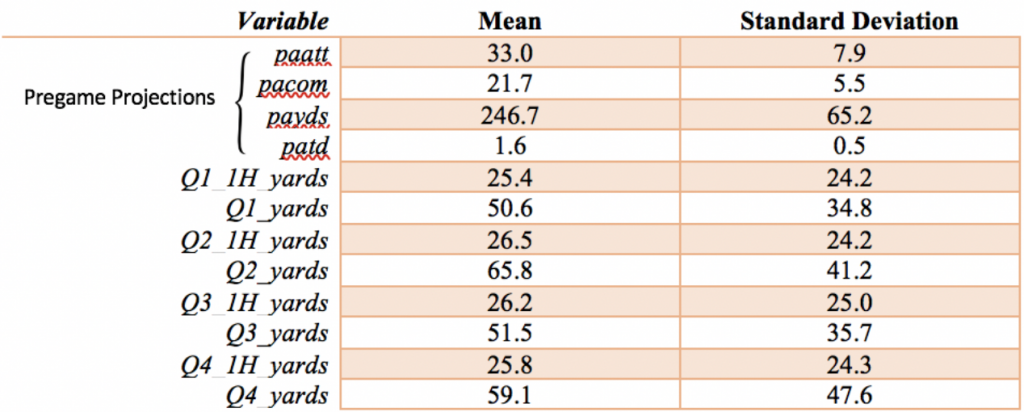
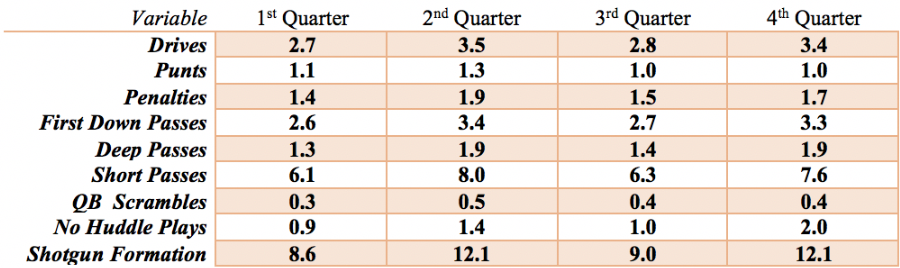
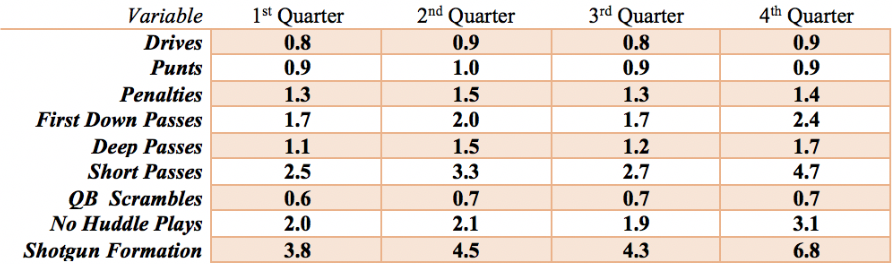
Projecting player performance means controlling specific game variables that the player has little to no influence on. This includes Situational variables, which are variables that record the conditions of the game at the same time my live Player Prop wager is available to bet on. These variables, which were also scraped from pro-football-reference.com, include the current down, the current yardline the ball is on, the score of the game, etc. Other variables we needed to control for were Game Flow Statistics, which were running counts for types of plays and situations that typically occurred in an NFL game. Table 2 and Table 3 below shows the summary statistics for the Game Flow Statistics.
Results
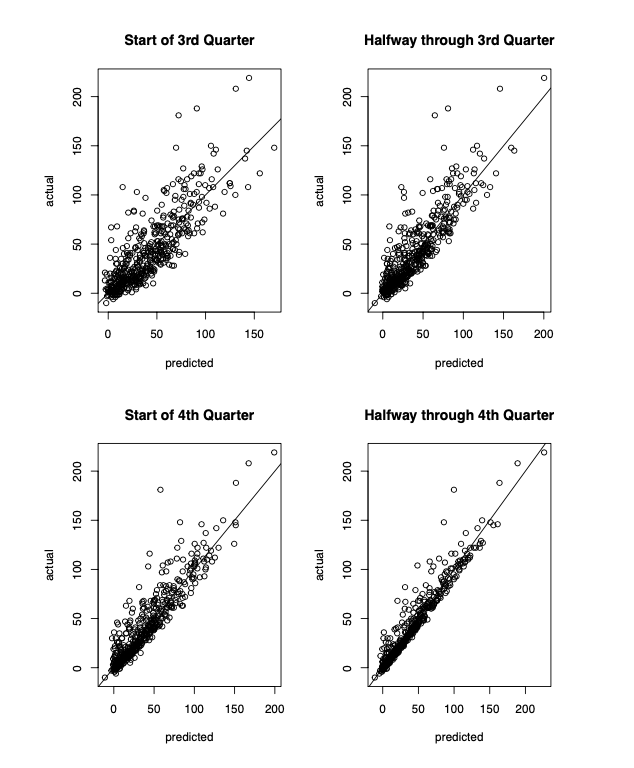
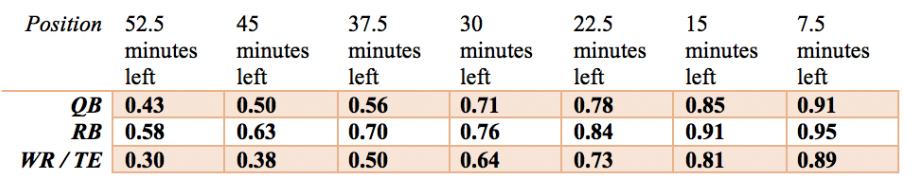
My models yielded successful results, which entails accurate projections for various player statistics. For each different player prop, I created seven different models that were scheduled over seven different time intervals to produce predictions for that given time period. The adjusted R-squared values for each of my models are posted in Table 3. As the game goes on, my models get more and more accurate (higher R-squared values). This makes sense given my models contain more game information as time goes on in the game.
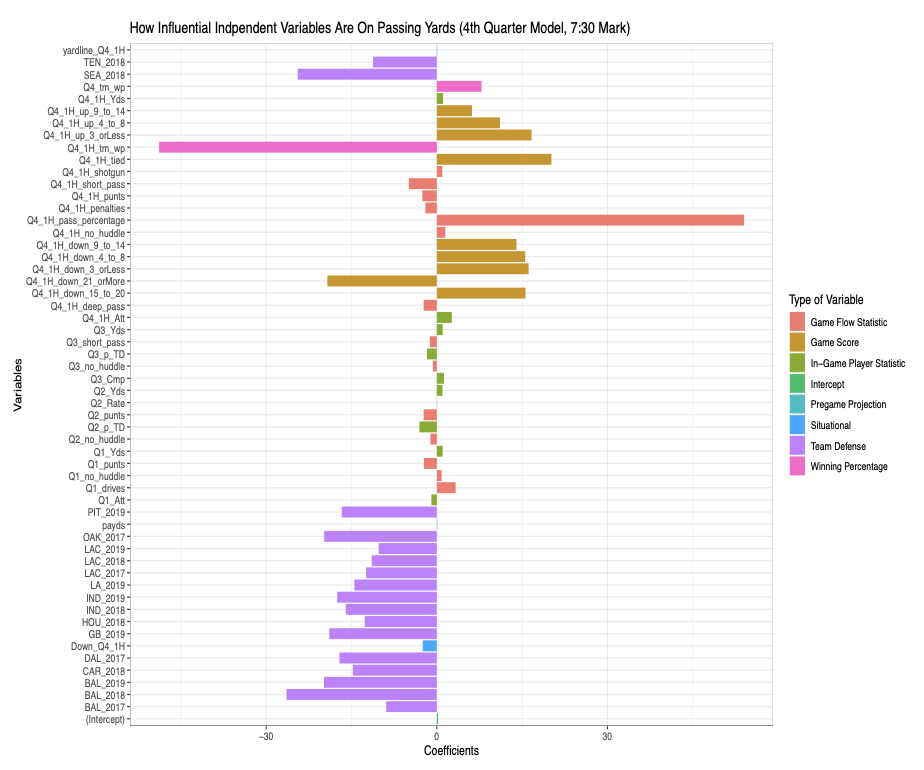
I grouped the independent variables in my models to help analyze how much influence each group had on my predictions. Figure #2 below looks at the coefficients of my independent variables and shows how much influence they had on passing yards halfway through the fourth quarter. An interesting takeaway from Figure #2 is how team winning percentage had a coefficient of -48.8, which was the largest negative coefficient from the model. This indicates that teams that are more likely to win halfway through the fourth quarter are less likely to throw for more yards heading forward. Other takeaways from this graph include how all team defensive variables were negative coefficients and how most scoring situations had a positive effect on passing yards except for when a team was trailing by 21 or more points.
Conclusions
I was able to complete my objective for the project: build a series of accurate player prop models. Figure #3 at the bottom of the page shows how my predicted values continue to get more accurate as time elapses in the game.
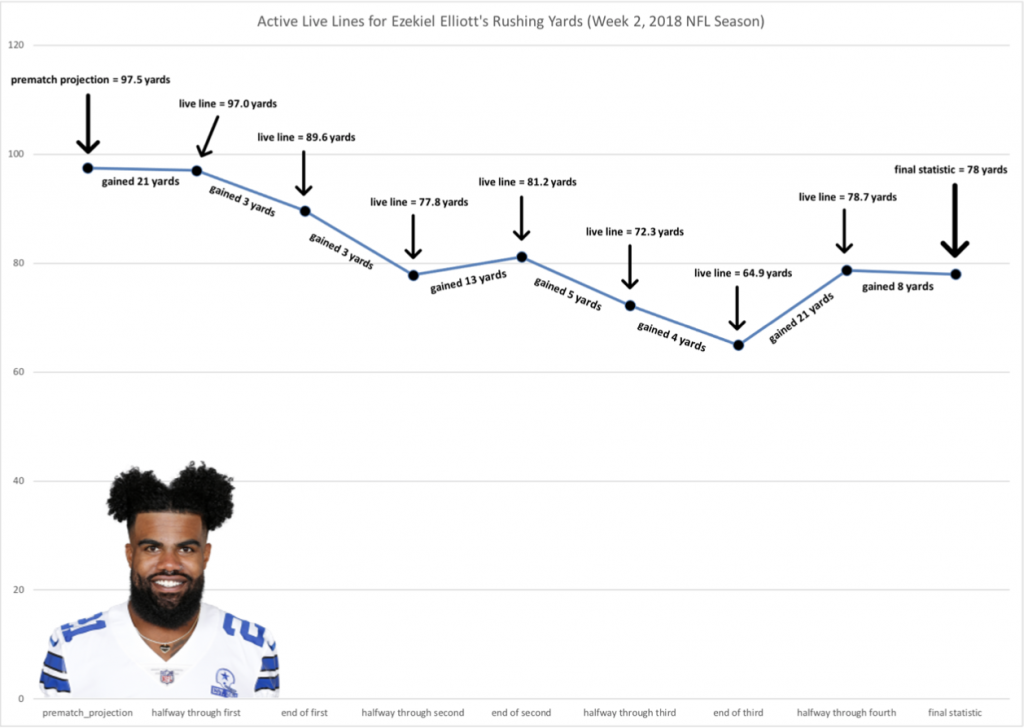
Figure #1 in the bottom left of the poster illustrates the performance of my live Running Back yardage prop line alongside the actual live performance of Ezekiel Elliott. My closest prediction to Elliott’s final yard count was my last prediction with 7.5 minutes remaining in the game. This reinforces my point that as time elapses, my predictions become more and more accurate.
In my analysis, I was able to identify a plethora of significant variables that all had an influence on my predictions. When looking at Quarterback passing yards, Team Defensive variables along with team winning percentage had a consistent negative influence on my predictions. On the other side, Game Score variables along with team pass percentage typically raised our projections with a consistent positive influence.
The variables in my models had different effects for different position groups. Team Defensive variables had a consistent positive influence on Running Back rushing yards, the complete opposite effect these variables had on Quarterback passing yards. Each variable has a different effect for each position group, making it all the more interesting seeing different players’ performances influenced with every model.
Predicting live player performance is a delicate process, but overall this project allowed me to see the ins and outs of what truly effects how NFL players perform and why.