
By Kushal Shah – Syracuse University ’21
Abstract
Attacking strategies in soccer are what decide the outcome of game. Choosing to play with a slow build up possession style, a fast-based counter attacking style, or something completely different are important decisions for a manager that can help improve the chances of his team to win. Understanding the correlation between the build up play and expected goals can provide immense value for a manager to improve his team’s efficiency when attacking.
This paper attempts to create a method to identify these attacking styles and unravel the correlation. This can help determine the value of each attacking technique for a specific team. These attacking strategies are identified using a clustering algorithm on event data across multiple leagues and seasons. The event data groups data together creating passing chains which is fed into a clustering algorithm to group similar attacks together. These clusters (attacks) can be analyzed by various performance measures. A framework to identify attacks with event data provides an immense amount of value for teams to identify their tendencies and their opponent’s tendencies.
The identification and analysis of these attacks can also be very beneficial in comparing specific teams or managers such as Jurgen Klopp and Pep Guardiola. They are 2 managers that have been wildly successful with attacking philosophies that are very different and are also 2 managers who have clashed in various leagues.
Data
Data was collected from Statsbomb’s public GitHub repository. This data consisted of event level data for a random sample of games across 7 leagues/competitions from 2000 to 2019.
The event data collected was manipulated to create data regarding passing chains. The metrics used within the data that described the passing chains includes:
- Duration
- Start Location (XY coordinate)
- End Location (XY coordinate)
- Averaged Location of Chain (XY Coordinate)
- Average Pass Details (Length, Angle, Height, Type)
- Passes inside the box
- Play Pattern
- Position of Player Playing the First and Last Pass
- Resulting xG from the Chain
- Event resulting in the Chain ending
These metrics provide enough information and describes a chain accurately allowing the clustering algorithm to classify similar passing chains together.
Methodology
The goal is to create a framework that can use event data to identify attacking styles. To provide an example, using a passing chain we can determine if it is a counterattack, long ball, or a slow possession focused build up attack.
This method uses a probabilistic clustering approach to identify the type of attack. A probabilistic approach allows us to provide the likelihood of each possession being a certain type of attack. Therefore, an attack that begins as counterattack and then develops into a possession-based attack does not be forced into one cluster. The probabilities can help reflect this.
To create this probabilistic approach, we used soft based clustering. Soft based clustering assigns each point a probability of belonging to each cluster. Specifically, we use Model Based Clustering. Model based clustering creates clusters that are modelled using a Gaussian distribution that utilizes a mean vector and covariance matrix. In simpler words, using geometric features these clusters are created. As Model Based Clustering is a 3D clustering algorithm, the geometric features include shape, volume, and orientation.
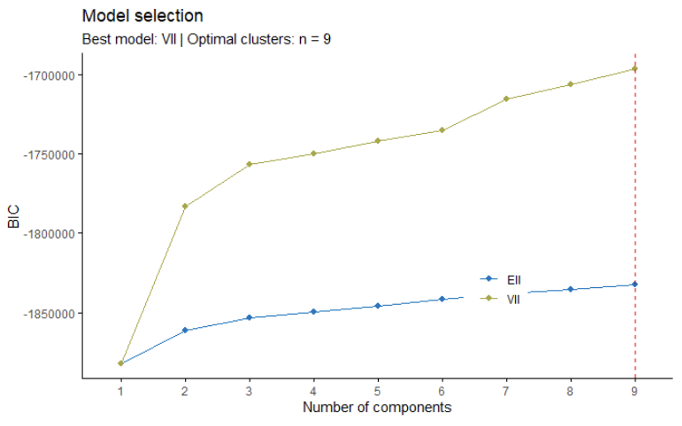
A key feature and benefit of Model Based Clustering is the optimal number of clusters is selected for you and is not arbitrary. The maximization function is selected based on the aforementioned geometric features. Below is an example for how clusters were selected for the World Cup. A VII model was used with 9 clusters selected. The second-best model is also highlighted in the graph (EII). A VII model implies the clusters were created with the key differentiators of the data being the variable level of volumes and the identity of the shape and orientation.
This clustering approach was used for all 7 leagues in the case we identify different league trends. Moreover, due to format of leagues and competitions being different, the most accurate clusters would be to use each league separately. The distribution of chains within each cluster were interesting to note and can be further analyzed.
Current Results
The applications of this framework are immense. Below is a simple exploratory analysis of each league, each cluster and the attacking passes completed within the box. Within each league we can clearly see there are fluctuations with the passes in the box among the cluster. This implies certain attacking strategies are in fact better in allowing a team to reach a shooting position inside the opponent’s box. Moreover, across the leagues we can see by the vertical axis of each graph have slightly different scales showcasing the different play styles or defensive ability across these leagues.

Conclusions, Future Work, Limitations
The framework in place helps identify traits for each passing chains that allows us to classify a chain as a certain attack. Above is a very simple application of this however the possibilities are endless. A future application I personally plan to explore is predicting passing chains using the previous chain. Using a Long Short Term Memory Model (LSTM) we can understand the impact previous passing chains have on a team or opponent’s next attack. The probabilities especially provide
This is by no means a finished product and can be further improved upon. Better descriptive data can result in more accurate clusters and using a different soft clustering approach could provide better results.
References
- De Lara, N. (2020, February 12). Introducing Pass Value, Evaluating Passing in Soccer.
- Knuston, T. (2018, August 30). Explaining xGChain Passing Networks.
- Soccerlogic-Gianni. (2019, May 13). Possession chains and passing sequences.
Acknowledgements
I would like to thank Dr. Rodney Paul who has not only me helped me throughout the process of this research project but has provided me with guidance throughout my entire academic career here at Falk.