
By Bailie Brown – Syracuse University ’21
Abstract
How to quantify starting pitcher effectiveness in Major League Baseball is an issue that is debated often and typically lacks a clear answer. There are many factors to consider when evaluating a pitcher’s performance: pitch count and innings pitched, quality of contact, runs and/or baserunners allowed, and whether a win was achieved, among others. Injury history, age, and days of rest between outings play some role in effectiveness as well, but that role is harder to quantify. This research analyzes the relationships among days of rest, innings pitched, pitches, age, and in-game outcomes. The main goal is to figure out how much of a role each plays into a pitcher’s ”effectiveness.” Recent data was used in order to apply newer metrics relating to contact quality to the results. Healthier pitchers who threw at least 100 innings each season were studied, as opposed to factoring injuries into the analysis. Regression and cluster analysis are used together to describe the variables’ relationships.
Introduction
How to describe a starting pitcher’s effectiveness is often considered subjective and hard to quantify. There are various routes to take when figuring out this issue. A lot of the existing research heavily focuses on a pitcher’s injury history and rehabilitation, so this research aims to isolate just the performance of healthy pitchers, and how that performance is affected by factors like days of rest, pitches and innings thrown, and age.
With the new wave of metrics that appeared readily available in 2015, there were new possibilities regarding pitcher analysis. This research aimed to use those metrics to its advantage and put less weight on traditional statistics such as ERA and pitcher wins – although they were still considered. The average quality of contact a starter gave up was relied on heavily as a way to measure his effectiveness. Relationships among the included variables are shown and discussed in depth throughout the analysis.
Methodology
The dataset for this analysis includes all starting pitchers who threw 100+ innings for 2 or more consecutive seasons from 2015-2019. This sample was determined by the availability of Statcast metrics and the need for a full 162-game season. Game log and season-level data were collected. Important variables included days rest, pitches per IP, exit velocity, launch angle, batted balls and their outcomes, pitch type, and several expected metrics.
After preliminary data relationship exploration, regression analysis was used to determine the effects variables had on pitches (total and per start) and xwOBA. Clustering followed to visualize the groupings of related variables. Age, launch angle, exit velocity, xwOBA, strikeouts, and batted balls are included in the group of clustered variables.
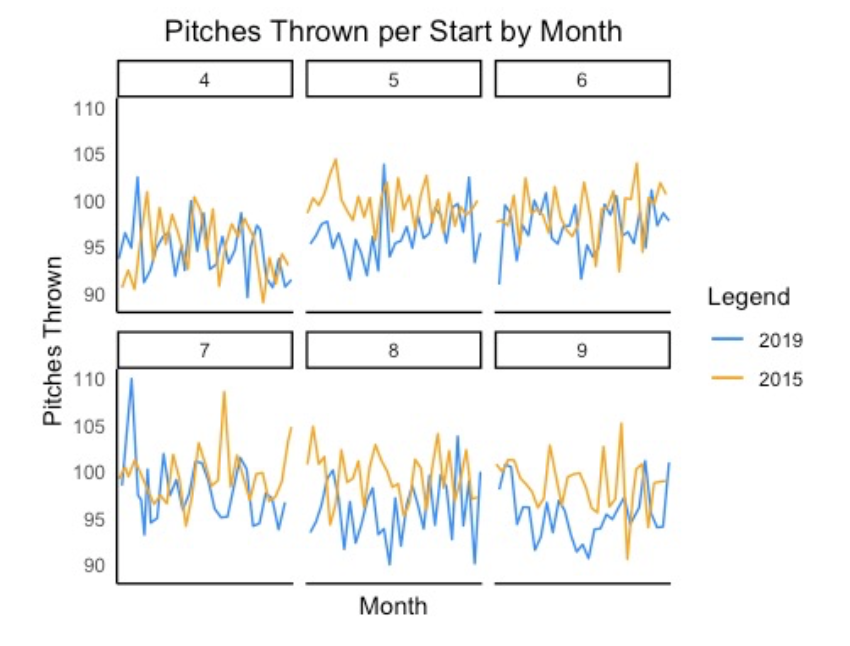
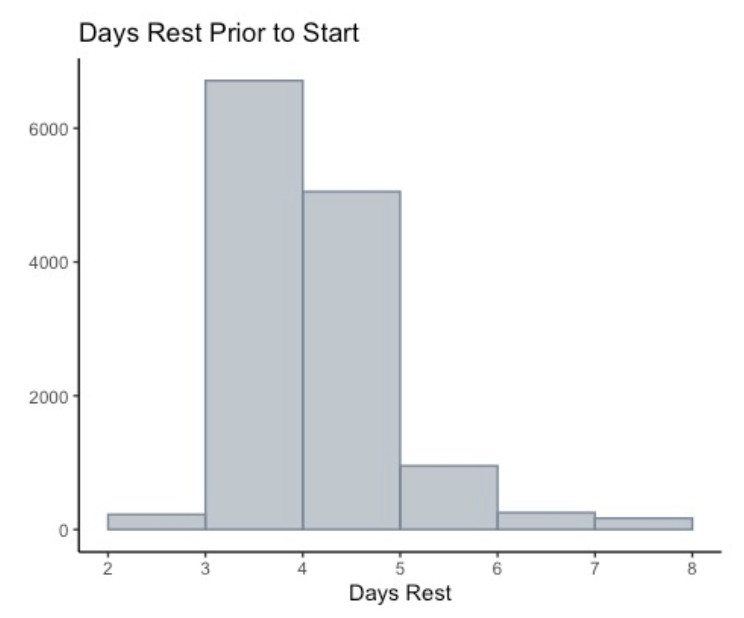
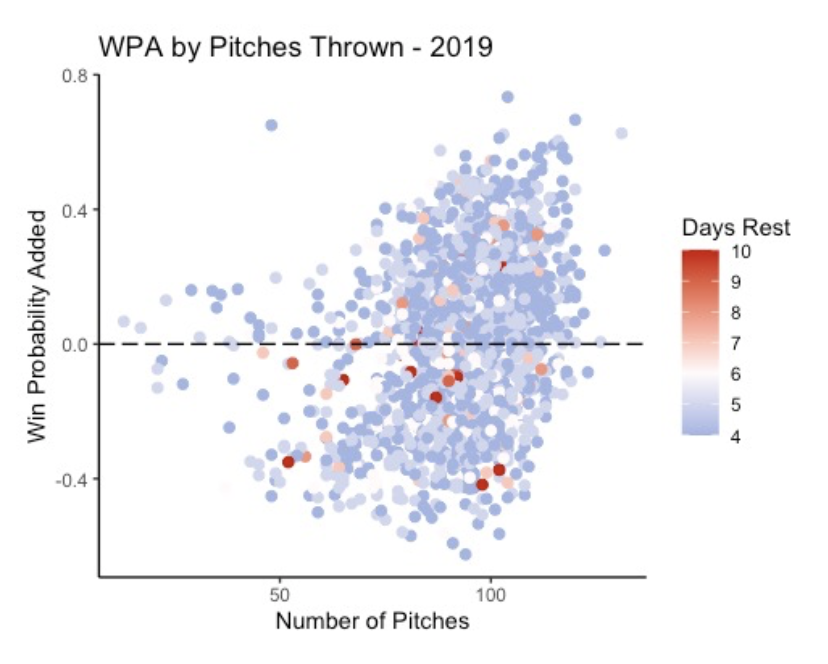
As displayed by Figure 1, visualizing the relationships between important variables was done prior to analysis. Here we see that while most starts had 4-5 days of rest before them, there were a good number that had as many as 6. Figure 2 takes a slightly different approach, looking into how many pitches were thrown per start over time. The 2015 and 2019 seasons were studied to show how trends had changed over the course of the dataset, and it became clear that across most of the season, 2019 starts averaged noticeably fewer pitches. Figure 3 looked at how those pitches correlated with WPA and found that if 100+ were thrown there was a higher likelihood of a positive WPA. Coloring by days rest, we reach the interesting conclusion that a higher number generally means a worse WPA.
Results
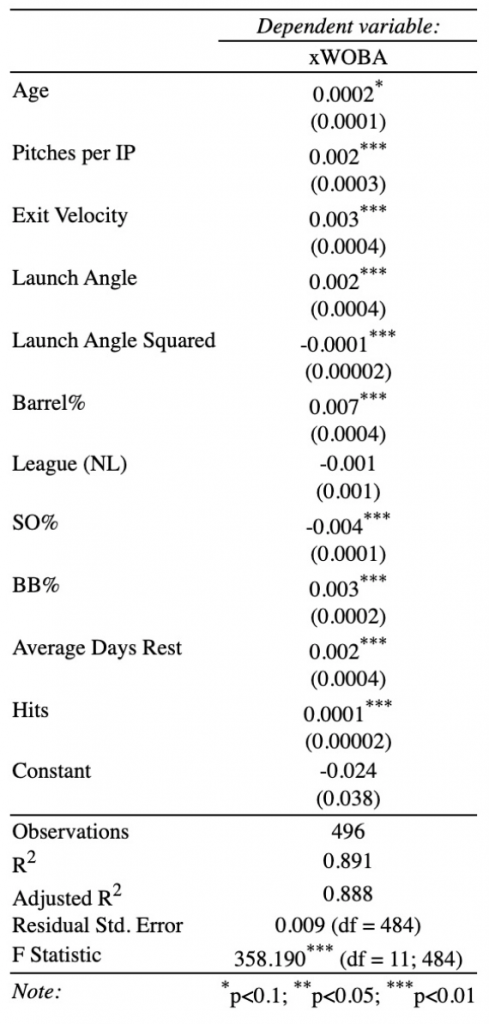
Three linear regressions were run to further investigate the relationships between variables. Figure 4 shows the most prominent one, using xwOBA as the dependent variable. The expected wOBA was used in order to isolate the quality of contact given up by each starter, as opposed to including defense-influenced outcomes. It is seen that all but one variable are significant, and all but age at the 1% level. Notable results include SO% having a high, negative magnitude and high days rest and P/IP counts leading to an increased xwOBA value. Launch Angle and LA2 have an interesting parabolic relationship, where an increased LA leads to a higher xwOBA, but that increase occurs at a decreasing rate. At a certain point, a high LA begins to benefit the pitcher rather than the batter.
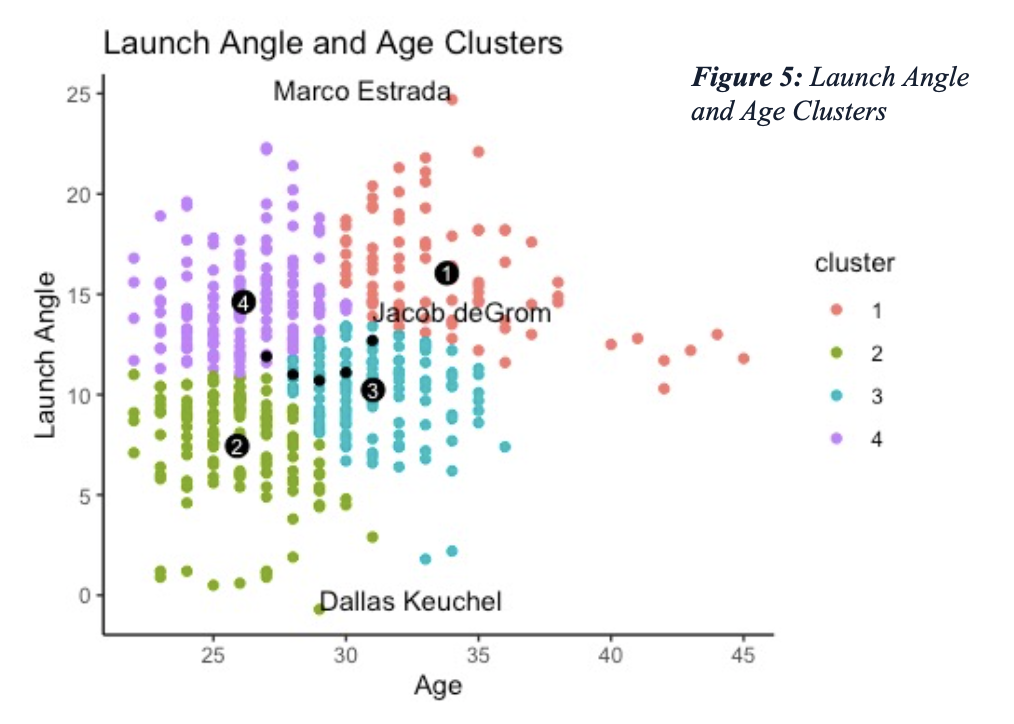
After modeling the variables’ relationships, cluster analysis was used to focus on their groupings. Figure 5 shows one such plot, using the significant launch angle variable. These clusters show that starting pitchers whose age averaged 25 – 31 years (often considered in their prime) kept their average LA consistently low (clusters 2 and 3). However, there was a large group average 26.2 years of age who struggled to keep their LA at a manageable value. Cluster 1, which had the highest average age, also had the highest average LA by far – concluding starters seem to induce less ground balls as they age.
Conclusions
In this analysis, linear modeling and clustering were used in order to investigate the relationships between factors such as days rest and pitches thrown with starting pitchers’ game outcomes. Preliminary analysis showed that the number of pitches thrown per start has notably decreased over the past 5 full seasons, but days rest has not. It became clear that a lot of metrics, such as exit velocity, launch angle, strikeout and walk percentages, and average number of days rest had significant impacts on measures of a pitcher’s effectiveness.
Overall, a starter produced lower, more manageable levels of contact when they had fewer (or normal) days of rest, were younger, threw less pitches, and allowed fewer walks. Starting pitchers can apply these results to future starts, or teams can use them when evaluating their starting rotations.
References
- Bollman, J. “The Effect of Rest Days on Starting Pitcher Performance.” FanGraphs Community Research, 7 Oct. 2017, community.fangraphs.com/the-effect-of-rest- days-on- starting-pitcher-performance/.
- Bradbury, J., & Forman, S. “The Impact of Pitch Counts and Days of Rest on Performance Among Major-League Baseball Pitchers” Journal of Strength and Conditioning Research: May 2012 – Volume 26 – Issue 5 – p 1181-1187
- Jaffe, J. “Starting Pitcher Workloads Have Been Significantly Reduced in 2020.” FanGraphs Baseball, 7 Aug. 2020, blogs.fangraphs.com/starting-pitcher- workloads- have-been-significantly-reduced-in-2020/.
- Whiteside, D., Martini, D. N., Zernicke, R. F., & Goulet, G. C. (2016). “Changes in a Starting Pitcher’s Performance Characteristics Across the Duration of a Major League Baseball Game.” International Journal of Sports Physiology and Performance, 11(2), 247-254.
- Brand, J. C., Hardy, R., Raymond, B., & Tiwaloluwa, A. (2015). “Do Innings Pitched Prior To Age 25 Affect MLB Pitcher Longevity?” Orthopaedic Journal of Sports Medicine.