
By Harrison Platt – Syracuse University ’21
Abstract
Daily fantasy competitions exist on various platforms with a wide array of competitions. Many of these competitions consist of selecting a roster while abiding by salary restrictions. The roster must contain a plyer from each position and can be any player playing that day. Each player has a price set by the platforms with the higher costing players expected to score more fantasy points.
I will be investigating fantasy baseball with hopes of determining whether fantasy sites and platforms are overcompensating for the hot-hand-hypothesis by overpricing players as well as what factors contribute to the hot hand if any, through an array of models and visualizations.
Introduction
The overall goal of my research was to determine if fantasy baseball platforms were overcompensating for the hot-hand-effect when setting their prices for players in daily competitions. The hot-hand-effect states that “a person who experiences a successful outcome has a greater chance of success in further attempts.” There is a multitude of variables considered when pricing players such as opposing matchup, amount of rest, weather, home or away, ballpark game is being played in, and prior success or failures as defined by “the hot or cold hand’’. After an abundance of research, I decided the best way to attack this was to look at each position player separately and answer the following questions:
1)At what rate does this position player outperform their expected fantasy points?
2)Does this position player outperform their expected fantasy points more often when they are rested?
The first step towards answering these questions was defining what a “hot player” was. This was done by gathering data on hundreds of players game by game performance over the course of the 2015 Major League Baseball Season through the 2019 season. This culminated in four separate datasets:
- Draft Kings Pitchers
- Draft Kings Hitters
- FanDuel Pitchers
- FanDuel Hitters
Each player in the dataset was assigned an expected performance in terms of FanDuel or Draft Kings points which was calculated using the coefficient of a regression that had player performance as the independent variable and player salary as the dependent variable which was then multiplied by the players salary for that respective game. If they scored higher than their expected performance, they were deemed hot.
After teetering with the data for some time, the next step was modeling. I produced a model and box plot that was run for all 9 positions on the baseball field. The one issue I ran into was that some players were not playing enough games to be included in the sample. In order to account for this, two measures were taken. The first consisted of only including players who were above the median salary for their position group in the data. For example, the median for all catcher salaries in the dataset was $3,100 meaning all players priced below this were not included in either the model or the plot. The second strategy employed was making a cutoff for the number of games the players had to play in over the 5-year span.
Models and Plots
Logistical Model: (run 18 times for all positions in each dataset)
Independent Variable: Salary, interaction of Rest with Hotcold
Dependent Variable: Fantasy points scored by player
Box Plot Model: (run 18 times for all positions in each dataset)
Facet Grid Split: Not Rested vs. Rested
X axis: Rest
Y axis: Fantasy points scored by player
Notable Results
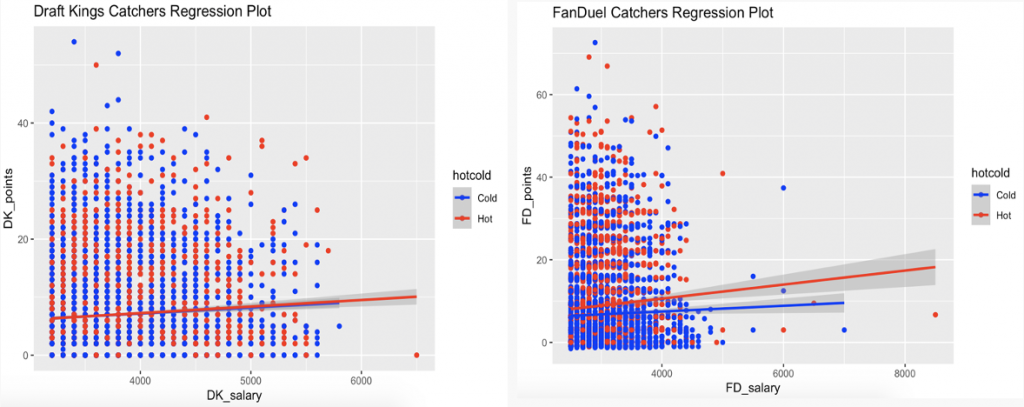
Logistical Model (Catchers)
The main point of the model was to see if being hot or cold was a good predictor of fantasy points scored. By running this same model for each position on both platforms, I was able to get insights on which platform may be overcompensating by seeing if the hot variable was statistically significant or not. If it was not statistically significant then the platform may be overcompensating as being hot didn’t seem to matter in predicating the model. Ideally it should be statistically significant with the notion that being hot results in scoring more points. For catchers, the hot variable was not statistically significant for Draft Kings but was for FanDuel.
Logistical Model (First Baseman)
The hot variable was statistically significant for FanDuel, but not Draft Kings, while the interaction of hot and rested was statistically significant for Draft Kings, but not FanDuel.
Logistical Model (Second Baseman)
The hot variable was statistically significant for Draft Kings and FanDuel.
Box Plot (Catchers & Pitchers)
The main point of this plot was to identify if rest impacted player performance. The original notion was that this would certainly be true for certain positions that require strenuous actions every game such as pitchers and catchers. Surprisingly, rest did not prove to matter in terms of fantasy production as players who were not rested scored about the same as those who were rested for both pitchers and catchers.
| Variable | Coefficient | P-Value |
| Draft Kings Salary | 0.0002 | 0.001*** |
| Rested | 0.241 | -0.605** |
| Hot | 0.161 | 0.207 |
| Neither | 1.084 | -1.586 |
| Rested X Hot | 0.367 | -0.549 |
| Rested X Neither | 1.196 | 0.150 |
| Variable | Coefficient | P-Value |
| FanDuel Salary | 0.0002 | 0.001*** |
| Rested | 0.240 | -0.622*** |
| Hot | 0.266 | 2.415*** |
| Neither | 2.352 | -5.652** |
| Rested X Hot | 0.373 | -0.738** |
| Rested X Neither | 2.432 | 4.243* |
Key:
X=Interaction
*=p-value below .1
**=p-value below .05
***=p-value under .01
Discussion
After finishing modeling, the next step was figuring out what everything meant. By going through each position, I was able to not only compare platforms, but find different significant factors for each position. Specifically looking at rest, it was noticeable that no positions’ fantasy point production was affected by lack of rest or extra rest. This is interesting as it brings up the point of maybe rest potentially equating to rust or it could possibly mean that some players benefit from days off by resting and working on their game while others overthink and try to fix too many things on their day off. One would think rest would be beneficial for catchers and pitchers as they have to exert a lot of energy in each game they play, but the box plots say differently.
As for the hot and cold models, they offer insight into both platforms occasionally overcompensating for the hot hand in certain positions. This is interesting and can be explored by those who play fantasy baseball competitions on these sites by avoiding the higher priced players in the positions that are overcompensated for as shown in my paper.
Conclusions
o Draft Kings overcompensates for the hot hand in the following position groups:
• Catchers
•Pitchers
•First Baseman
•Shortstop
•Third Baseman
•Left Fielders
•Right Fielders
o FanDuel overcompensates for the hot hand in the following position groups:
•Pitchers
o FanDuel clearly does a better job of compensating for the hot hand which should make Draft Kings easier to exploit if you avoid selecting players who are hot and as a result are being overpriced by Draft Kings
o Rest Doesn’t appear to matter in terms of fantasy production