
By Zak Koeppel – Syracuse University ’21
Abstract
A common problem that National Football League (NFL) teams face is building a roster around a highly paid quarterback. In the NFL, teams face strict spending limits, better known as a salary cap. Most teams must pay a premium for the quarterback position since it is the most important position on the roster, meaning they are devoting a high percentage of the cap to one player and making it difficult to employ quality players at many other positions on the roster. This is a common problem that NFL teams are facing so these results can be useful to teams trying to remain competitive despite rising quarterback salaries. My analysis looks at teams from the 2013-2019 NFL seasons that spent 9% or more of their salary cap on their most expensive quarterback. The analysis for the poster divides teams into four IQR ranges for each starting position on a team: teams that spent in the bottom 25% on the position, teams that spent in the 25% – 50% range on the position, teams that spent in the 50% – 75% range on the position, and teams that spent in the top 25% on the position. The results I focused on were those for the four currently highest paid non-quarterback positions. The wide receiver 1 results show that teams show spend either in the 25% – 50% range or top 25% but avoid the bottom 25% range. The left tackle 1 results show that teams should avoid the just above average players in the 50% – 75% range. For the edge rusher 1 position, teams should acquire an elite edge rusher if given the opportunity and avoid the 50% – 75% range. Finally, for the cornerback 1 position, teams should look for player just below the elite tier in the 50% – 75% range and avoid overspending on the top of the position in free agency.
Introduction
In the National Football League, teams are limited in how much they can spend on the players on their roster due to a salary cap. For the 2021 NFL season, the league-wide salary cap is $182.5 million. The quarterback position, which is the most important position on the football field, typically takes up a large portion of a team’s cap space. One of the common ways teams build under the salary cap is to employ a quarterback on a rookie contract. This allows them to save on the most expensive position and allocate that money to the rest of the team, which can put a stronger roster on the field. Once a quarterback gets through his four-year rookie contract, teams have little choice but to pay him a massive contract. Since the team is paying their quarterback so much of the cap, they have limited funds to be allocated elsewhere. My analysis seeks to find optimal ways to spend the limited funds remaining after paying the quarterback. My hypothesis is that the currently highest paid non-quarterback positions are the optimal positions to spend on: Wide Receiver 1, Left Tackle 1, Edge Rusher 1, and Cornerback 1.
Method
Since this project only looks at teams with a highly paid quarterback, only NFL teams that spent 9% or more of their salary cap on their most expensive quarterback qualified for the dataset. The data for this project was collected from Spotrac and Pro Football Reference. Salary data was collected for every player on every team with a highly paid quarterback for the 2013-2019 NFL seasons. The chart below shows how many times each team qualified for the dataset (out of the seven possible years) along with their win percentage over the 2013-2019 seasons.

On each team, the starting players were designated with their ”role” (RB1, RB2, WR1, WR2, etc.) to analyze spending on a more specific positional level instead of just looking at a position as a whole (RB, WR, etc.). The roles were designated based on the team’s depth chart from the beginning of that season.
For this analysis, teams were separated into four IQR groups based on their spending at every specific position. Teams were grouped into the bottom 25%, 25% – 50%, 50% – 75%, and top 25% groups based on how much of their cap space they allocated to a position like running back 1 or wide receiver 1. From there, the average win percentage of teams in each group were calculated. The groups and average win percentages were also calculated for the four different facets of a football team: skill position players, offensive line, front seven defenders, and defensive secondary. Finally, I used tree models to validate these results, and a tree model featuring offensive positions can be seen below.

Results
The tables below feature the results of the IQR analysis divided up into four groups: skill position players, offensive line, front seven defenders, and defensive secondary. Note: avg win percent in sample is 0.5271
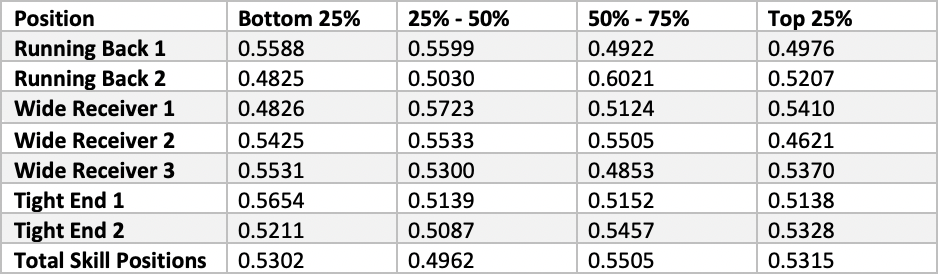
Looking at the running back 1 position, we can see that investing highly in a starting running back does not give good returns. This is backed up by past research and the common analytical trend to not pay running backs. Wide receiver 1 has interesting results because the numbers show you don’t want an inexpensive player or rookie leading the receiving group, but you want a player in the 25% – 50% range. Finally, tight end 1 is a position that teams can save cap space on. The tight end position has very few elite players, so unless a team has one of those, they should look for an inexpensive option.
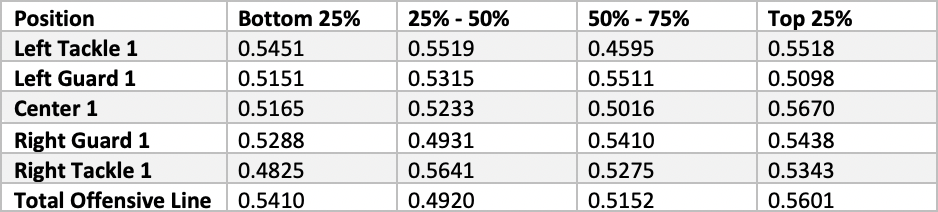
On the offensive line, the position of note here is left tackle 1. The results back up that teams can and should continue to spend highly on the position, but they can also have success with a rookie or inexpensive option. Like many other positions, teams do not want to spend in the 50% – 75% range.

The edge rusher 1 position is the key position in the front seven, and the results show that teams should invest in a top edge rusher if available. On the contrary, teams should save on edge rusher 2, specifically if they have an expensive edge rusher 1.

Cornerback 1 results show that teams should either save and spend in the bottom 25% or spend in the 50% – 75% range. This result could be due to bad free agent overpays on the cornerback 1 position. Finally, the most interesting result I found was that spending highly on strong safety 1 gives great returns, which was not an expected result.
Conclusions
In conclusion, we see an overall trend among positional spending to spend either on rookies in the bottom 25% range or elite players in the top 25% range, while avoiding spending in the 50% – 75% range. Basically, if you don’t have an elite talent at a position, save on that position with an inexpensive rookie contract player instead of trying to fill the spot with an average player. Looking back at the original goal to find an optimal structure, these results give us a general structure of which positions to spend highly on and which to save on. The positions teams should spend money on include left tackle 1, center 1, edge rusher 1, and strong safety 1. The positions that teams should save money on include running back 1, tight end 1, left guard 1, and inside linebacker 1 and 2. It is key to note however that this can vary by team based on the personnel they have since no team starts building their roster from a clean slate. Much of a roster is carried over from year to year but teams can still implement a plan like this over a multi-year timeframe. I believe this is just the beginning of research into salary cap allocation around a highly paid quarterback, so I plan to continue to build on this with different types of analysis to complement the results found here. There is a lot of room to add here as salary cap management is a relatively untapped area of sports analytics.