
By Jonathan Bosch – Syracuse University ’21
Background
➢ It can be very difficult to determine a player’s impact on the outcome of an NBA game solely based on the player’s box score stats.
EX: Damien Lillard
- Regular Season (03/07/2019): 51pts 5rebs 9asts – POR 121 – OKC 129
- Game 5 West 1st Round (04/23/2019): 50pts 7rebs 6asts – POR 118 – OKC 115 & a game-winning 37-foot buzzer beater
➢ With the buzzer-beating shot context, we see how Lillard’s performance in the playoff game vs OKC had a greater impact on Portland winning the game than his performance vs OKC in the regular season, but how can we quantify it?
➢ NBA Leverage of Field Goal Attempts: The squared difference between the win probability if the shot was made and the win probability if the shot was missed.
➢ In order to calculate NBA Leverage of Field Goal Attempts, we must have the ability to calculate a team’s win probability at any point during the game. Therefore, I will model home team win probability as a product of in-game contextual variables (such as the score, time remaining, the strength of the opposing team, and more).
Data
➢ I acquired 3 full seasons of NBA Play-by-Play data from basketball- reference.com (2016-17, 2017-18, 2018-19).
➢ The data includes:
- Game information (date/time, teams, Vegas Odds*)
- Game context (score, time, winning team)
- Game events (box score events, substitutions, timeouts, etc.)- Game events similar to ESPN’s Play-by-Play:

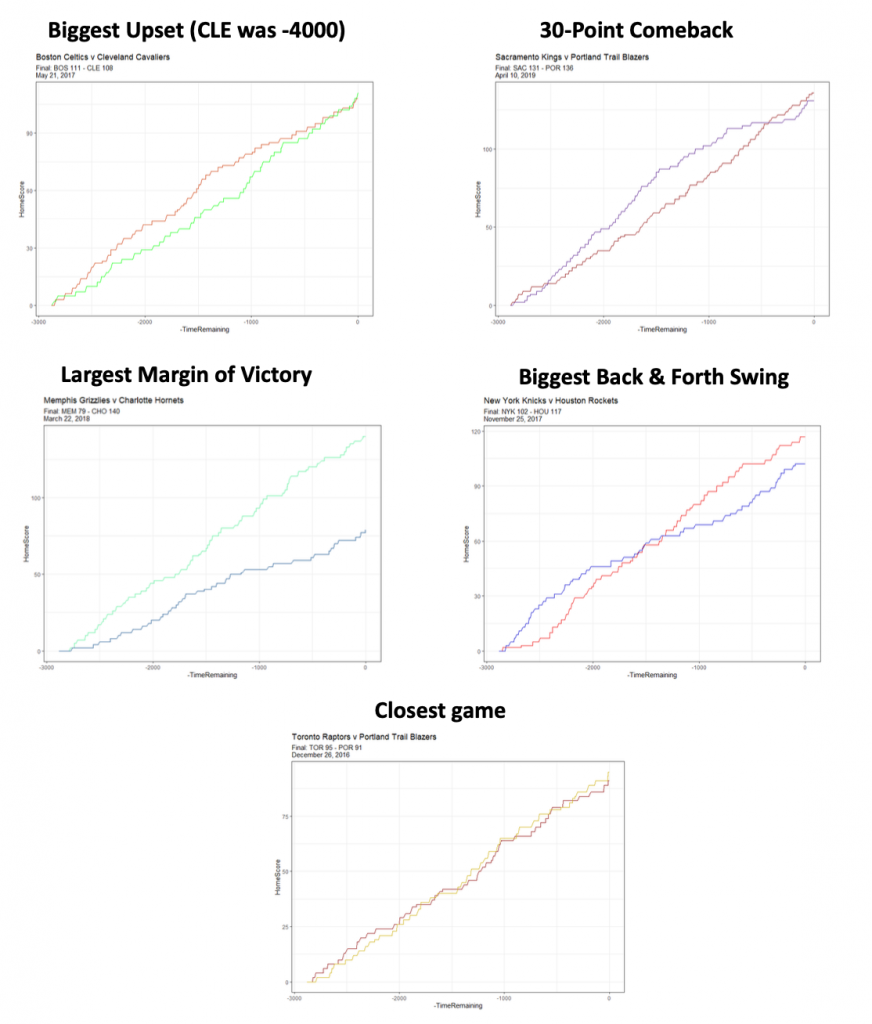
Scoring Trends
➢ Following modeling live win probability, it will be useful to visualize the win probability trend throughout the game and compare it to the visualized scoring trend. See below, some interesting games during the 3 seasons of data.
Win Probability Modeling
➢ I modeled win probability with respect to the home team
➢ The response variable was if the home team won the game or not (1 or 0) ➢Independent contextual variables I included across my models were: Scoring Margin, Time Remaining, Vegas Odds, Team Factors
➢ Best model (Brier Score of 0.1326):

| Variable | Coefficient |
| Intercept | -1.493 |
| HomeTeamMargin | 0.3091 |
| TimeRemaining | 0.00006721 |
| TimeRemaining*HomeTeamMargin | -0.0001041 |
| HomeTeamVegasWinPct | 2.336 |
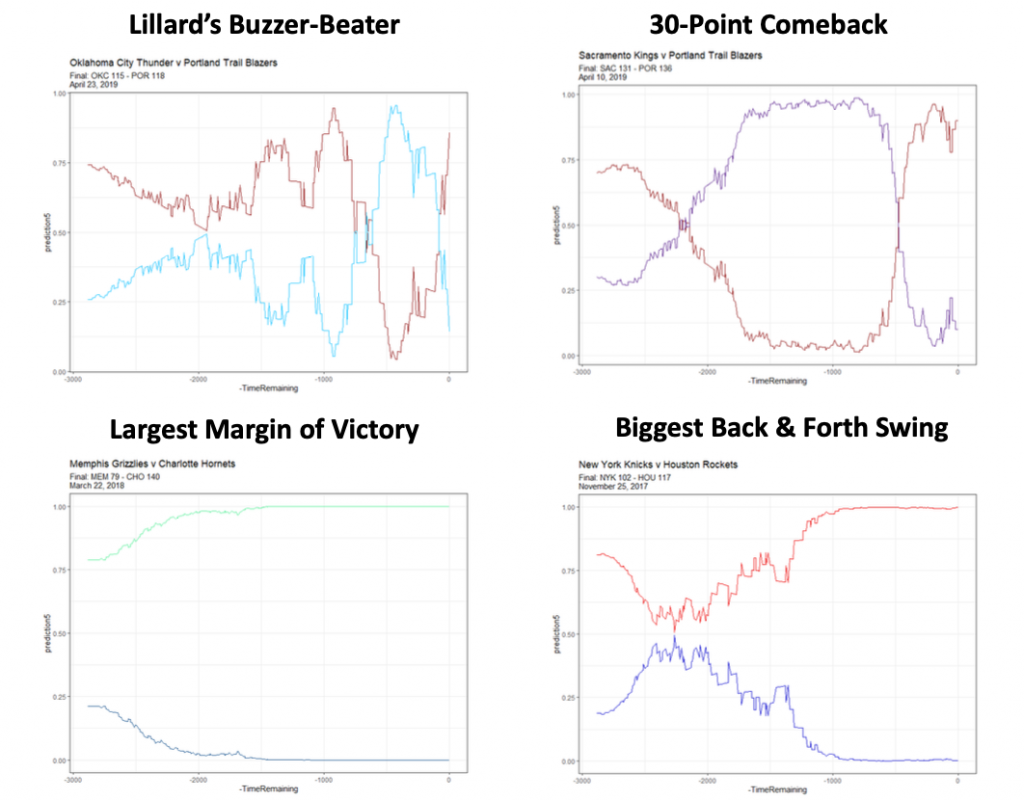
➢ Win probability trends for some of the games previously discussed:
Leverage Index
➢ You are probably wondering, what was Lillard’s leverage on his buzzer beater? It was 0.0235, which is pretty high, but only the 9th highest leverage shot of the game. Why? Because if he had missed the shot, the game would be going to overtime, and my model would still slightly favor Portland to win the game in overtime due to their Vegas Odds to win the contest.
➢ The shot with the highest leverage in my data was 0.0519. Richaun Holmes of the Philadelphia 76ers missed a three-point shot at the last second that had it gone in, would have sent the game to overtime and allowed the 76ers more time to defeat the Los Angeles Lakers.
➢ I was very satisfied with my top 200 leverages, all occurring with less than 1 minute remaining in the 4th quarter.
➢ As assumed, the highest leverage shots occur late in close games, where stakes are highest. Now, we have the ability to determine which shots “mean” the most in an NBA basketball contest.