
By Dylan McGee – Syracuse University ’21
Abstract
Since the creation of baseball, many rules that were originally set in place have stayed consistent with the current version of the game. One major rule that needs to be questioned is the utilization of relief pitchers. Relief pitchers have been classified under the following “roles:”Closers, Setup Men, Middle Relievers, Long Relievers, Left-Handed Specialists, and Openers. Once a player has a certain role for their team, they are expected to perform in those situations of the game. However, how can we determine who a true “closer” is? What makes a player fit this role? Typically, a team would assess all the relievers on their roster and assign roles based on standard statistics that have been around for years. What if, using a dataset with Standard, Advanced, Batted Ball and PFX data, we were able to cluster players based on their metrics? This way, we can reclassify relievers based on the groups they fit in compared to all the pitchers in the league, not just their team.
Introduction
Purpose
Having college baseball experience in the past as a reliever, I always wondered why my job was to throw in the 8th inning as a “Setup-Man.” I knew my strength was getting ground balls, so why couldn’t I come in whenever the team needed to keep the ball on the ground?
What is K-Mans Clustering?
K-Means self-determines a best-fit centroid by finding the mean of a group of points in a continuous n– dimensional space. For successful analysis, we must determine an initial number of centroids, or groups, which will be represented as K.
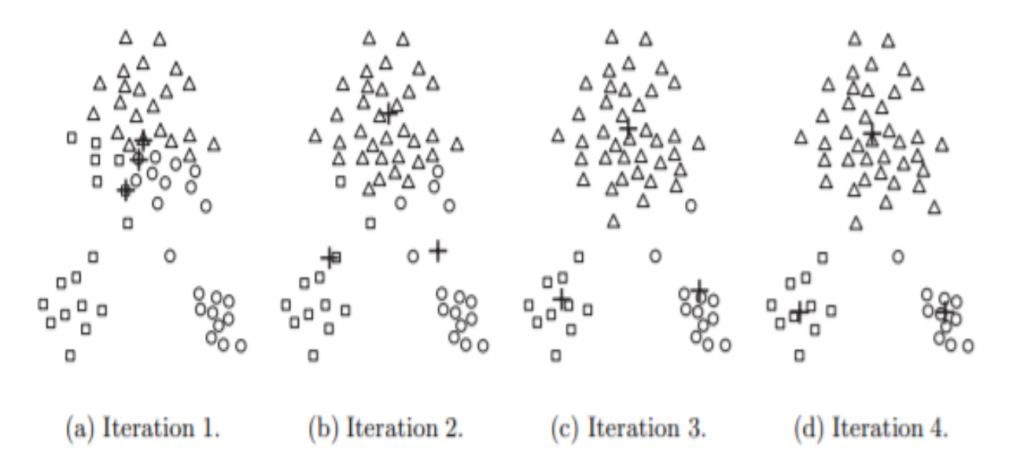
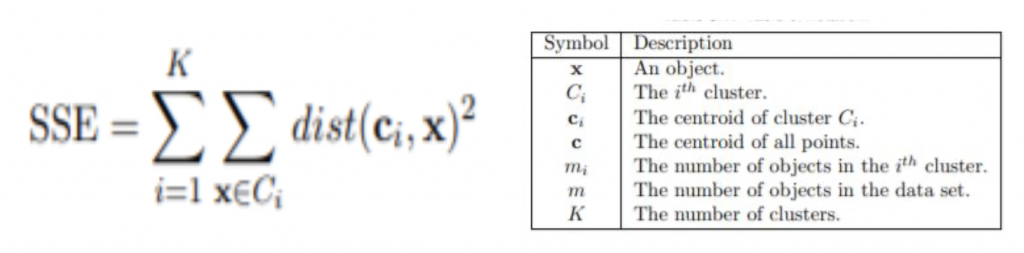
The formula to calculate the best-fit centering from a group of points is shown below:
Hypothesis: Clustering relievers can create a better method for teams to setup their bullpen and have more success on the defensive side of the field.
Method
Data was collected from FanGraphs. It includes only relief pitchers since the post-steroid era (2005-present) with a minimum of 20 innings pitched. The custom data was exported, cleaned and normalized so each variable held the same amount of weight during the clustering.
From there, a correlation matrix was created. It is important for each variable to be uncorrelated with one another so each statistic can accurately draw conclusions for each cluster. The variables used for analysis are below:

The only variables which had slight correlation were Outside Zone Swing % and Zone %. Both were kept in the data because it was determined the correlation score of -0.5 was not enough to be significant in the results, and both metrics explain a lot about relievers pitching styles.
An Elbow Plot was created to determine the number of clusters necessary for analysis. After running the test and performing numerous test runs, 7 clusters determined to be ideal for the strongest conclusions.

Results
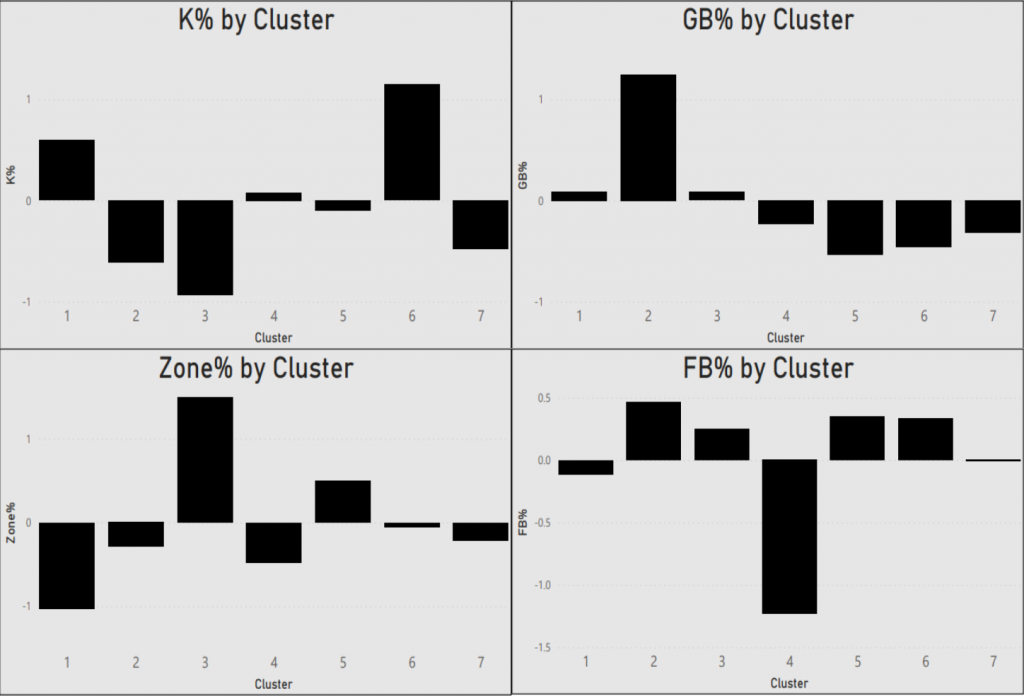
Each cluster resulted in having its own unique strengths and weaknesses. The K-Means Clustering successfully separated all relievers into 7 groups based on patterns of performance and pitching tendencies. For example, group 6 significantly leads in K% and group 2 significantly leads in GB%.
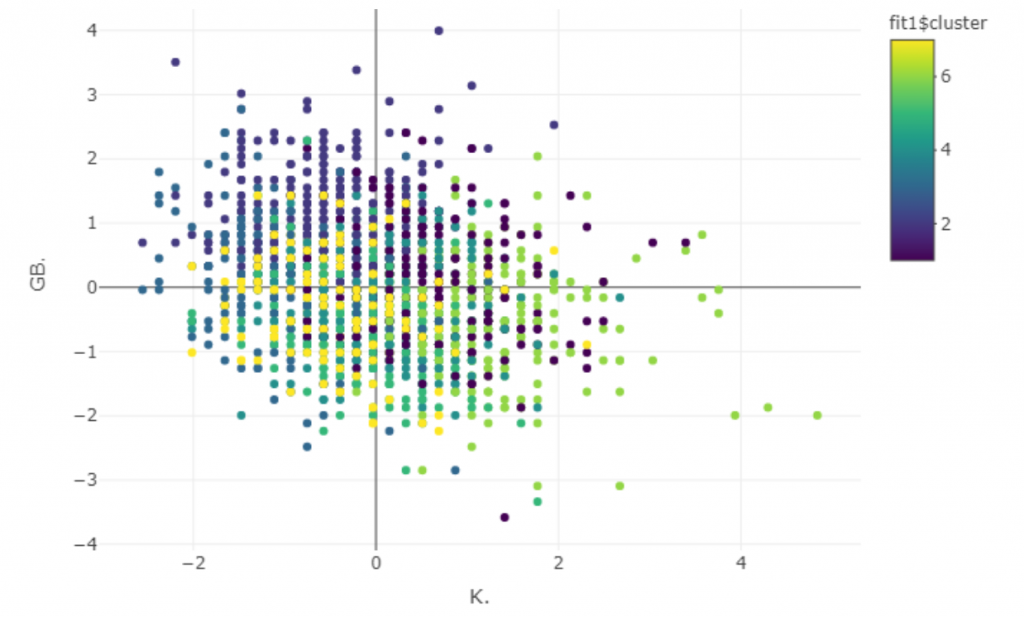
A 3D and 2D graph were created to see how tight each cluster was/ if there were significant outliers for each group.

Conclusions
The concluding clusters are shown below. If teams reclassified their bullpen into these groups and used them in situations which fit their strengths, I believe pitching staffs could improve drastically.
| Cluster | Role | Usage | Notable Player |
| 1 | High Velocity Specialists | By far highest velocity average. Excel in K’s but can struggle with command. Use when looking for strikeouts or big velocity change. | Jordan Hicks |
| 2 | Ground Ball Specialists | Highest GB%, produce weakest contact but fewest K’s. Use when trying to keep the ball on the ground or looking for double play. | Zack Britton |
| 3 | Accuracy Specialists | Leaders in Zone% and low BB%. Use when trying to limit free bases via walks. | Trevor Hoffman |
| 4 | Chase Artists | Have great off-speed which is used to get batters to chase outside of zone. Use when looking to limit contact at all costs. | Sergio Romo |
| 5 | Average Reliever | Relievers that don’t excel in anything but also not below average. Good cluster to use in any situation. | J.A. Happ |
| 6 | Strikeout Specialists | Leaders in K%. Use when looking to limit contact via strikeout or against batters with high K%. | Aroldis Chapman |
| 7 | Least Reliable | Worst group. Have the poorest numbers in most categories. Use when out of options/up or down by a lot. | Dereck Rodriguez |
References
- Woltring, M. T., Rost, J. K., & Jubenville, C. B. (2018, October 25). Examining Perceptions of Baseball’s Eras:https://thesportjournal.org/article/examining- perceptions-of-baseballs-eras/
- Bodig, C. (2017, October 23). The History of Relief Pitching Part One: 1871-1945. Retrieved November 01, 2020, from https://www.cooperstowncred.com/the- history-of-relief-part-one-1871-1945/
- Palmer, P. (2018, May 17). Admin. Retrieved December 03, 2020, from https://sabr.org/journal/article/relief- pitching-strategy-past-present-and-future/
Acknowledgements
Thank you to Dr. Rodney Paul for guiding me through my Senior Thesis and being available when help was needed.
Thank you to former MLB pitcher Jacob Turner for helping me determine important variables to include for analysis.