
By Colin Krantz – Syracuse University ’21
Abstract
Betting on the finishing position of golfers in PGA Tour events can be some of the most valuable picks sports books have to offer. Whether it be a pick for a winner or a top 5/10/20 finish, most golfers will have underdog odds for their finishing positions. Attempting to take advantage of the high payouts for successful bets in golf, I have created a neural network that produces simulations of each golf event in the PGA season based on a set of 18 performance statistics. Each tournament is modeled separately based on statistics from every player who made the cut at that tournament in the previous 10 seasons. These previous season statistics are used to train the model, while current season averages for each golfer are used to test the model and create the predicted finishing positions. Based on the simulations and building confidence intervals for each player’s predicted strokes, two sets of player rankings are created to be bet on: safe picks and upside picks.
Introduction
Betting legality has been a widely expanding idea over the past few years, and with that, there are many ways to try and make money by out-predicting oddsmakers. Because of the extreme variability of golf (28 winners in 36 events in the 2020 season), the odds attached to player finishing positions are almost always at underdog odds. This project attempts to take advantage of these lengthy odds for player finishing positions by predicting total strokes for each player on a tournament by tournamentbasis and using those predictions to build an expected top 20, top 10, top 5, and winner. By betting on players at each level of finishing position given that they have underdog odds to appear within that finishing position and the statistical model predicts them within that finishing position, total monetary risk can be minimized with potential winnings being kept at a very high level. Based strictly upon probability, it should be expected that the most profitable predictions will be for top 20 finishes, and the least profitable would be top 5 or winner predictions.
Method
In order to predict a player’s strokes for any given tournament, I first had to decide which statistics were most available and most applicable for any PGA Tour event. The independent variables needed to capture a player’s ability to hit off the tee, approach the green, play around the green, and putting.
Off the Tee: Drive Distance, Drive Accuracy, Good Drives, Percentage of Drives in the Left Rough, Percentage of Drives in the Right Rough.
Approach the Green: Greens in Regulation, Hole Proximity from the Fairway, Hole Proximity from the Left Rough, Hole Proximity from the Right Rough, Going for Green, Scrambling Percentage, Bunkers Hit.
Around the Green: Sand Saves, Hole Proximity from Around the Green.
Putting: One Putts, Three Putts, Birdie Conversion, Bogey Avoidance.
For each tournament, the previous five years of player statistics are gathered and used to build a Neural Network that provide weights for each statistic to predict tournament strokes. Once those weights are determined, the current season statistics of the players participating in the upcoming tournament are used to run 100 simulations of the tournament. From those 100 simulations, the mean and standard deviations for each player are used to build a confidence interval for strokes.

Using this confidence interval for strokes, two different sets of rankings are created, one based on a player’s “ceiling” and one based on their “floor.” The lower end of the confidence interval would be considered their lowest expected number of strokes, and the upper end of the confidence interval would be considered their highest expected number of strokes. The reason to use the confidence interval values rather than the maximum and minimum value of the simulations is due to the possibility of outliers in the simulations. By using the confidence interval, I can be 99% confident that the true mean number of strokes will fall within the lower and upper end of the confidence interval. Using these two sets of rankings, FanDuel finishing position odds for players are gathered and bet upon for the predicted top 20/10/5/1.
Results
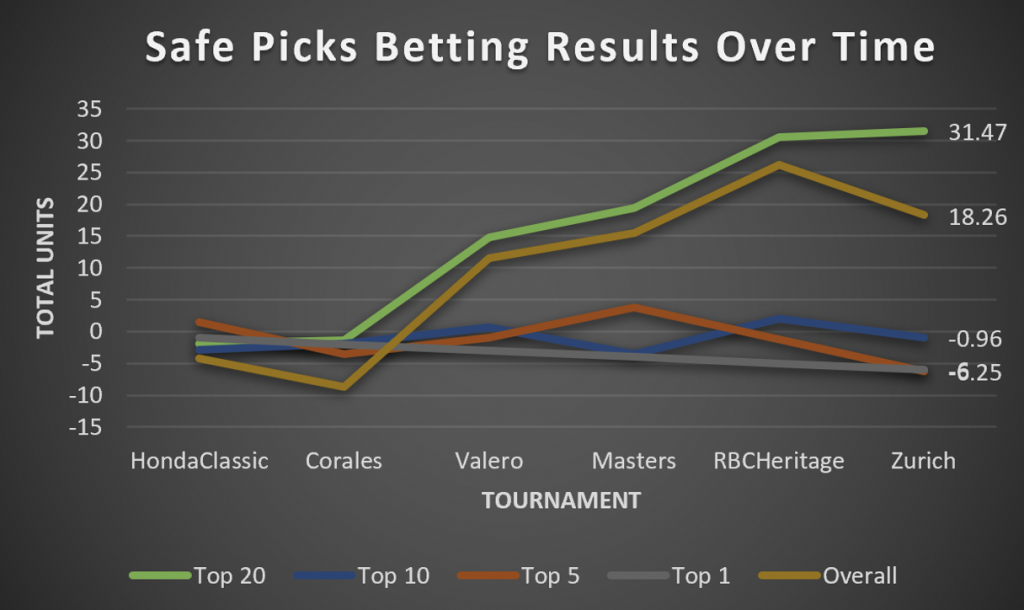
Based on these two different sets of rankings, it can be determined if players conform more to their ceiling or floor in golf competitions, and if it is easier to predict players to finish in the Top 20, Top 10, Top 5, or Top 1. The charts shown below represent the total amount of betting units someone would win if they placed one unit on each player with underdog odds that the rankings placed within the finishing positions. For example, if a player is predicted by the model to finish in second place and they have underdog odds to finish in the Top 20, Top 10, and Top 5, then three separate bets would be placed on them to finish within each of those finishing positions. If they are favored to finish in the Top 20, then only two bets would be placed on that player. Based on those betting methods, there will never be a bet placed higher than one unit, and if the bet wins, the win will be worth higher than one unit.
As can be seen in the charts below, both models have achieved significant and consistent success in betting on players to finish in the Top 20 (combined 70.92 units of profit over the previous 6 tournaments), and consistent low levels of success in predicting all other finishing positions. The upside picks are also more successful.

Conclusions
The main conclusion of this project is that there is significant value in betting on golfers to finish within the Top 20 of a PGA Tour event, but it is much harder to predict players to finish within the Top 10/5/1. This is likely due to the high variability in golf that was previously mentioned, as the best golfers just simply do not always win. Another conclusion that can be drawn from these modeling techniques is that it is better to predict events based on a player’s upside. Once again, this could be attributed to the high variability in golf, as the model with the higher level of success is the one that would favor players who have a high variance in their simulated predictions of strokes. Overall, the early success of the modeling techniques provided in this project show that there is some advantage in betting on PGA Tour event finishing positions.
References
1. Markets. (n.d.). Retrieved December 7, 2020, from https://labs.actionnetwork.com/markets?league=PGA
2. Pomeroy, K. (2020). Golf win probability model description: The kenpom.com blog. Retrieved December 07, 2020, from https://kenpom.com/blog/golf-win-probability-model-description/
3. Stewart, M. (2020, July 29). Simple Introduction to Neural Networks. Retrieved December 07, 2020, from https://towardsdatascience.com/simple-introduction-to-neural-networks-ac1d7c3d7a2c
Acknowledgements
I would like to thank Dr. Rodney Paul for his guidance during my completion of this project, as well as Falk College and Syracuse University for giving me the opportunity to complete my own research. I would also like to thank my old golf instructor and good friend Steve Hare for teaching me almost everything I know about golf. I imagine my life would have taken a much different route without his guidance.