
By Ethan Alpern – Syracuse University ’20
Abstract
The goal of this analysis to answer this question: How does a player’s increase/ decrease in salary each season impact their on-field performance? In order to try and find some answers to that questions, this analysis will look at the impact salary, age, player position and performance stats has on each player’s total value.
Introduction
With the rapid rise of sabermetrics in baseball, there are now more ways than ever to evaluate and predict the success of athletes. In addition to this, teams are become more fiscally conservative than ever which has been showcased over the past few offseason in free agency.
The combination of exorbitant amounts of data, the smartest minds in the world and owners’ unwillingness to break out the cheque book the Major League Baseball (MLB) world is at an impasse. Players have voiced their frustration at the silent shift from the old mantra where they would be able to recoup lost value from earlier in their careers through mega-contracts in free agency, to the new way of thinking which is making teams extremely cautious of investing that level of money and years into players once they reach a certain age.
Methodology
When creating linear model it is of the utmost importance that the correct variables are used, and one is aware of some elements the regression is unable to see. For example, a regression in this case will put a strong emphasis on the amount of games played because it gives a better representation of what that player can output over the course of a season, however, certain players are able to carve out a role playing a multitude of positions each with a handful of games played. These players may possibly be overlooked by the models I run but despite this I have decided to run three types of linear regression models. In addition to the three main models I also ran models specific to each position to see if there was anything unique about how one position progresses over another.
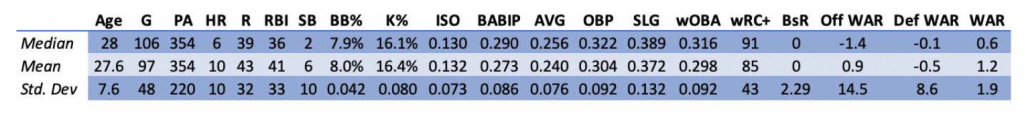
Exploratory Data Analysis
Most variables will be highly correlated due to the direct relationship many statistical success measures in sports have with one another. Generally speaking, players that play more have a better opportunity for success, those who hit more homeruns will drive in more runs, those who walk more will have a higher on-base percentage (OBP) and so on and so forth.
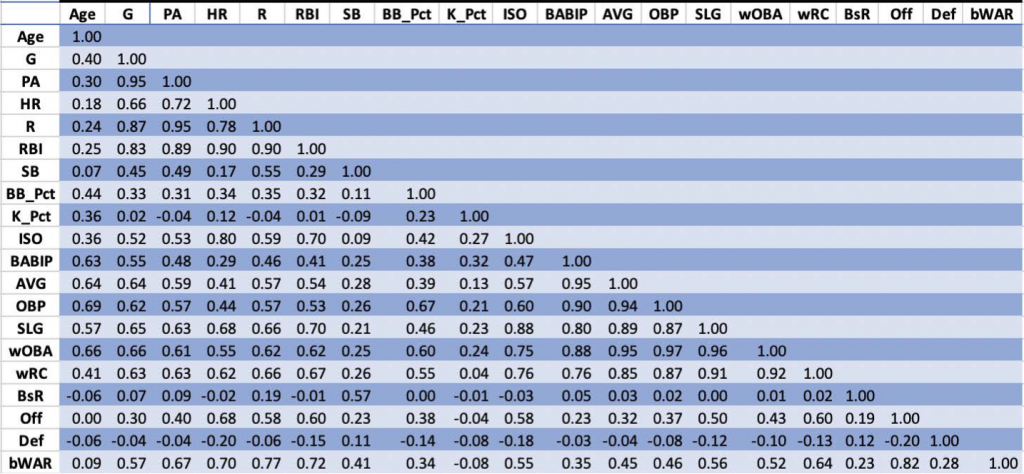
Given the small coefficients between variables, it was determined that everything could be run concurrently without issue.
Modeling
One of the models I ran looked at the effect a player’s contract value, age and position had on his overall performance or in this case WAR. In addition to those specified independent variables I also added an Age^2 variable. The purpose of this is to allow me to more accurately measure the effect age has on the dependent variable because its relationship may be non-linear. For example, age in sports is normally framed as a negative but in reality it is a positive element up to a certain point in which a player’s output begins to decline.
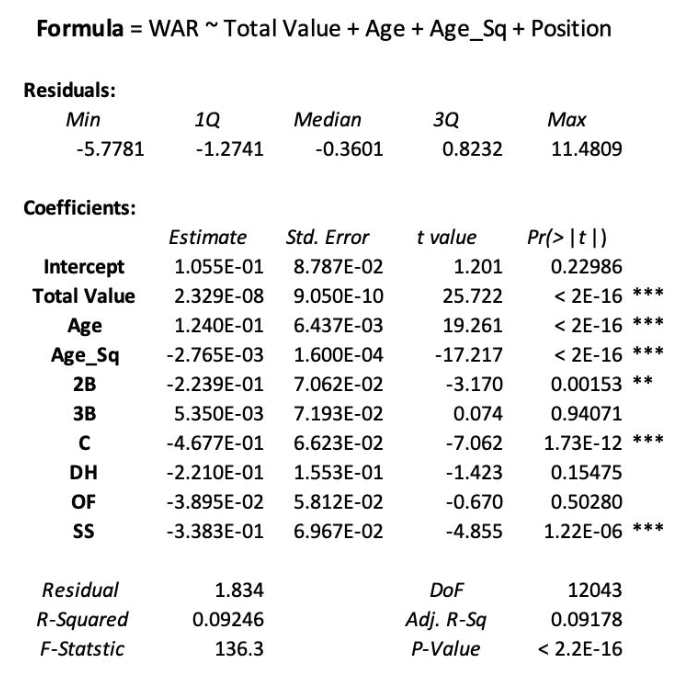
Given the results above the more obvious things that were assumed before the model was run turned out to be true. The total value and age of each player is very statistically significant at the one percent level, both with positive coefficients. On the other hand the Age^2 variable had a negative coefficient which suggests as a player reaches a certain age their performance will begin to suffer.
On the positional side of things only second basemen (2B), catchers (C) and shortstops (SS) were statistically significant. At the five percent level, 2B had a negative relationship with the dependent variable WAR which suggests that may not be a position you want to invest in long term. The same can be said for SS and C which were both statistically significant at the one percent level with negative relationships to the dependent variable. Of these positions, catchers make sense because their durability and longevity take a hit due to the higher levels of stress the position places on their bodies compared to a position like 1B. Below in Figure 3, a deeper dive is taken into both C and 1B to see how contract value and age affect each position differently.
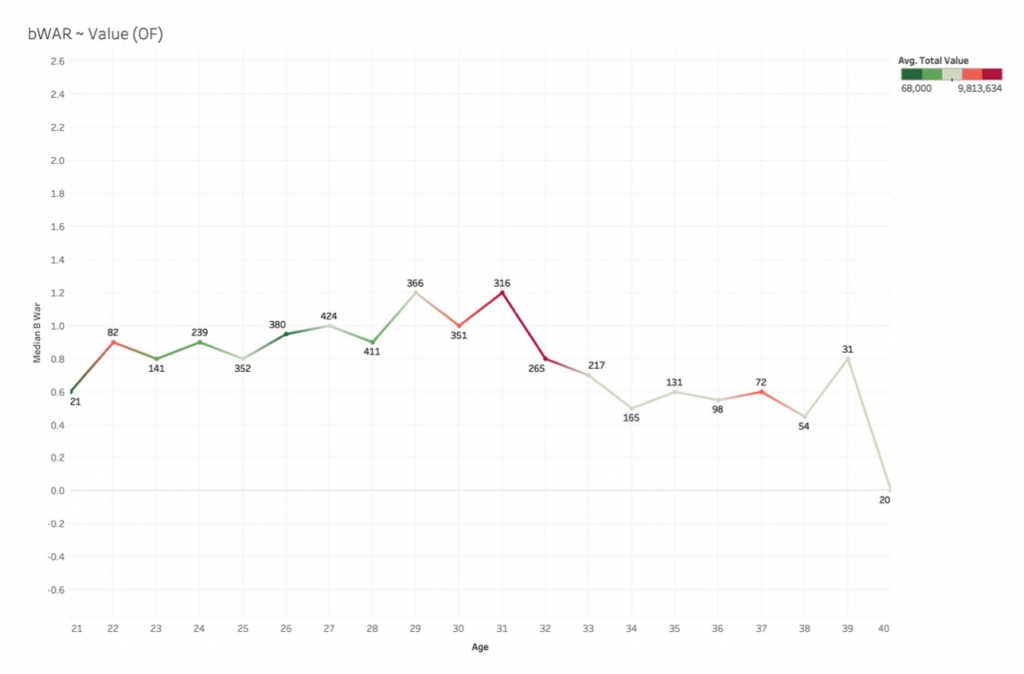
This concept is shown above, which takes a look at how the median WAR for OFs changes over time. The color of the line represents the average total value for OFs at that age with green equating to less money and red equating to more money.
Conclusion
The purpose of this analysis was to evaluate the effect that either an increase or decrease in salary from one year to the next had on the player’s overall performance each season. Each model analyzed different variables to assess their impact on the dependent variables WAR and salary differential. While this study is in no way fully comprehensive, I do believe it provides some insight into how teams should address how to evaluate player progression and positional value.
The first model which looked at the effect of total contract value, age, age2 and position on WAR. From this it is clear that age can be a positive factor for performance as each player grows into their primes, but these benefits quickly turn sour once that player reaches the plateau age. Additionally, positions like catcher and shortstop provide more return on investment due to the required abilities on both sides on the ball when compared to positions like first base and outfield.
I think some ways this study could be improved going forward would be to flesh everything out further by looking at how each player’s performance changes after receiving each big payday whether that be through arbitration, free agency or a contract extension. I think this would give a different prospective that might be more representative of the player’s true intentions by removing the variance and randomness of evaluating performance on a year by year basis.
References
- Cahill, M. J. (2014). Retrieved from https://dukespace.lib.duke.edu/dspace/bitstream/handle/10161/14794/Goldstein2017.pdf?sequence=1
- Edwards, J. (n.d.). On $/WAR, Its Linearity, and Efficient Free-Agent Contracts.Retrieved from https://community.fangraphs.com/on-war-its-linearity-and-efficient-free-agent-contracts/.
- Goldstein, D. (2017). Retrieved from https://dukespace.lib.duke.edu/dspace/bitstream/handle/10161/14794/Goldstein2017.pdf?sequence=1
- Lindbergh, B. (2019, December 6). Why You Should Be Optimistic-and Pessimistic-About MLB Free Agency. Retrieved from https://www.theringer.com/ mlb/2019/12/6/20998574/free-agency-mike-moustakas-zack-wheeler-yasmani-grandal.