
By Nick Riccardi – Syracuse University ’20
Background
The hardest task for a general manager in the National Basketball Association (NBA) is putting together a roster that can compete for a championship. Not only do they need to acquire enough talent to compete with the league’s best teams, they also need to find players that fit well together on the court. In the current NBA era that emphasizes the importance of three-point shooting and the role of analytics, current players are playing in roles that they never have before. Due to this, the NBA needs a redefining of positions differing from the traditional five player positions that better encompass the ways in which in different players play the game. This research aims to categorize NBA players based on the similarities in their playstyle as well as determine the types of players to fill out a roster with depending on the playstyle of a team’s best player.
Data and Methodology
Data were gathered from basketball-reference.com in the form of player-seasons. Each row of the data represents a specific player during a given season. The statistics for each player-season include per-game, shooting, and play-by-play stats. The player-seasons included in this research are players who played at least 41 games and 10 minutes per game from the past six NBA seasons. A k-means cluster analysis was performed on these player-seasons that resulted in seven different clusters that grouped players together based on the similarities between their statistics. After the cluster analysis, I analyzed the similarities of players within each cluster and the differences between different clusters in order to describe how the clusters were formed. Using ESPN’s Real Plus-Minus, the best player on each of the 180 teams represented in the dataset were determined. From there, the sum of the minutes played by each cluster for each team was calculated, not including the minutes played by the team’s best player. Using ordinary least squares, regression models were run using Pythagorean win percentage as the dependent variable and the number of minutes played by each cluster as independent variables. The goal of these models is to determine the clusters that affect a team’s expected win percentage depending on what cluster a team’s best player comes from.
Cluster Analysis Results
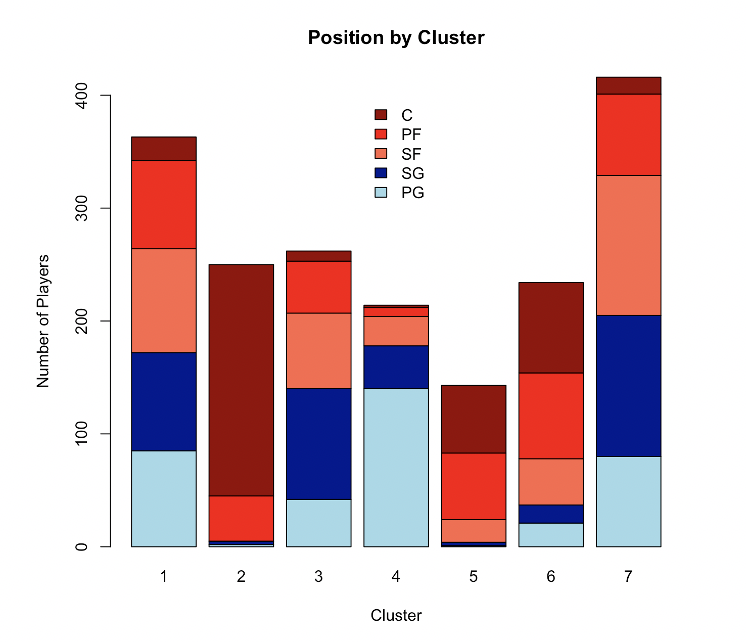
Each individual bar in this graph represents one of the seven clusters that are identified on the x-axis. The y-axis shows the total number of player-seasons in each of the clusters. Clusters one and seven have the highest number of players while cluster five has the least. The legend in the middle of the graph shows which colors belong to which position. Point guards are represented by light blue, shooting guards are blue, small forwards are light red, power forwards are red-orange, and centers are dark red. Looking at each of the bars, it Is clear that clusters two and five are largely dominated by bigs while cluster four is mostly guards. Clusters one and seven have similar breakdowns and are relatively evenly split between the five positions, besides a lack of centers in both. Cluster three is mainly filled with guards and small forwards, with an emphasis on shooting guards, while cluster six is mainly small forwards and bigs. Located below is a matrix of the positions and clusters .
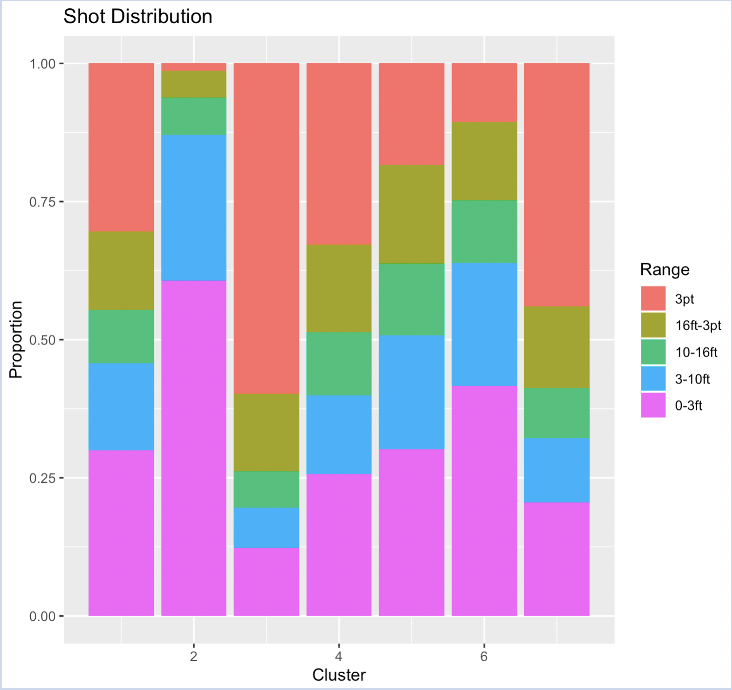
The distribution of shots is shown in each of the seven bars, organized from left to right starting with cluster one and having cluster seven all the way to the right. The legend on the right side of the graph shows that the purple represents shots taken within three feet of the basket, the blue between three and ten feet away from the hoop, the green between ten and 16 feet, the brown between 16 feet and the three-point line, and lastly the pink representing three-pointers. Right away, there are two clusters that jump out as being highly-specialized. First, cluster two shows that over 60% of the shots from these players are within three feet of the basket. Overall, cluster two players take about 87% of their shots from ten feet away or less and their average shot distance of 4.2 feet is less than half the average shot distance of the next shortest cluster. Secondly, cluster three players are specialized in the opposite fashion. Cluster three players take slightly under 60% of their shots from behind the arc and another 14% between 16 feet and the three-point line. Besides those two clusters, none of the other clusters’ bar charts jump off the page and clearly show the types of players that belong to them. Clusters one and four show similar shot distributions with most of their shots coming from within three feet or from three. Clusters five and six also have relatively similar distributions with cluster six taking less shots from three and more shots within three feet than cluster five players. Lastly, cluster seven’s distribution looks closest to that of cluster three’s but shooting less threes and being more evenly distributed.
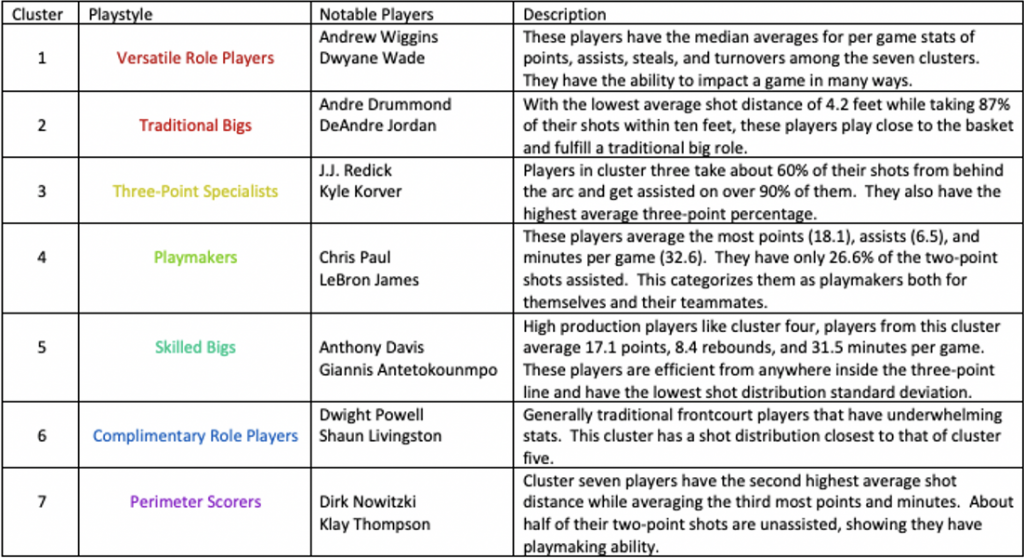
After analyzing the results of the cluster analysis, I determined the types of players that belong to the clusters. The following chart breaks down the playstyle of the players from each of the seven clusters.
Regression Models
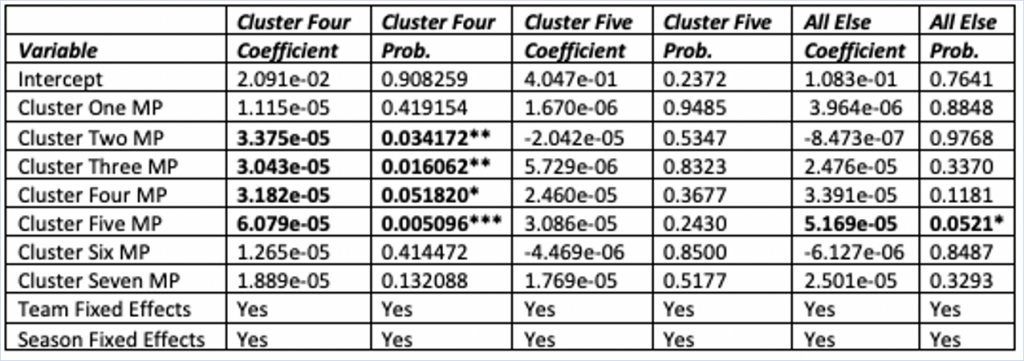
After looking at which players were determined the best for their teams, the teams were then divided into three subsections. Out of the 180 teams, 68 had their best player from cluster four, 50 from cluster five, and 62 from the remaining five clusters. Therefore, the three subsections are cluster four teams, cluster five teams, and the other five clusters were combined as “All Else” teams. Three separate regressions were run for the three subsections. The results of these combined in a table below.
Conclusion
The first regression model included only teams whose best player came from cluster four. In this model, the minutes for clusters two, three, four, and five were significant at an acceptable p-value and had positive coefficients. These results suggest that by playing these four clusters more minutes, the Pythagorean win percentages for these teams should increase. Considering the play style of cluster four players, these results make sense. Cluster two and cluster three players help these playmakers due to the specialization of their roles. By being able to run pick-and-rolls with traditional bigs to set up mismatches and easy buckets as well as having three-point specialists sitting around the arc, cluster four players have many different options on the offensive side. Cluster four minutes being positive indicates that a team can never have too many players that create shots for themselves and their teammates. Lastly, considering cluster five players can score at an efficient rate from just about anywhere on the court, it is a natural fit with players who are looking to find the open man.
Next, the same regression was run using the subsection of data that represented teams whose best players was from cluster five. Surprisingly, this model did not include any cluster minutes variable that was significant. Instead, the success of these teams largely depended on the quality of their best player. These teams often did well if their cluster five player was one of the elite players in the NBA and played poorly if their best player wasn’t a star. These results show that cluster five teams don’t necessarily perform better or worse given their composition. It would not be advisable to build a team around a cluster five player unless that player is one of the better players in the league.
The last model represented the last subsection of teams that consisted of having their best player from one of the other five clusters. Now, considering that these five clusters were grouped together despite being comprised of players who can have specifically different roles from one another, the results of this model could be influenced by certain clusters within the group of clusters. Nonetheless, one of the seven cluster minutes variables were significant, and that variable belonged to cluster five. The coefficient for this variable was positive, therefore, teams from this subsection may benefit by playing cluster five players a high number of minutes.
Overall, the goal of this research was to attempt to figure out which player styles played well with each individual player style. By conducting the cluster analysis, defining the clusters, and running the linear regression models, I was able to determine the effect that each cluster’s minutes had on the Pythagorean win percentage of teams from each of the subsections of the data. This study can be used as guideline to how NBA teams build around their franchise player in order to give them the highest probability of succeeding. For general managers in the NBA, acquiring talent that fits together is one of the hardest tasks they are asked to accomplish.