
By Joey Sabel – Syracuse University ’20
Abstract
In professional sports, fans love to speculate where leagues should expand or relocate if there is a struggling franchise. What these fans fail to realize is that the demographics of a city can set up a sport for success or failure beyond what they think is “a good fit” for a league. With the US sports market being dominated by the largest cities in the country, every so often, a small city like Green Bay, Wisconsin comes along and has one of the most successful teams in its league’s history. I would like to find out if there are any demographic factors that influence the likelihood of a city hosting a team in one of the “Big Four” leagues in the United States (MLB, NBA, NFL, NHL).
Introduction
In conjunction with my senior thesis for the Sport Analytics Major in Falk College, I explored why some cities are looked at for relocation and expansion and why others are not. Is it because of previous teams in the city, other teams in the city, city demographics, or some other reason? This poster aims to find if demographic differences are why some US cities are prime locations for professional sports.
Method
Through data collection from the 2018 US Community Survey and the Sports Reference Sites, I aimed to pair success of teams with city demographics to see whether teams were thriving or failing in conjunction with the demographics of their respective cities. I limited my dataset to cities with populations of 100,000 or higher to include the smallest US cities with teams.
Using various data analytical processes ranging from simple averages of similar cities to linear models to clustering, I implemented many ways of exploration for finding out why some cities are successful.
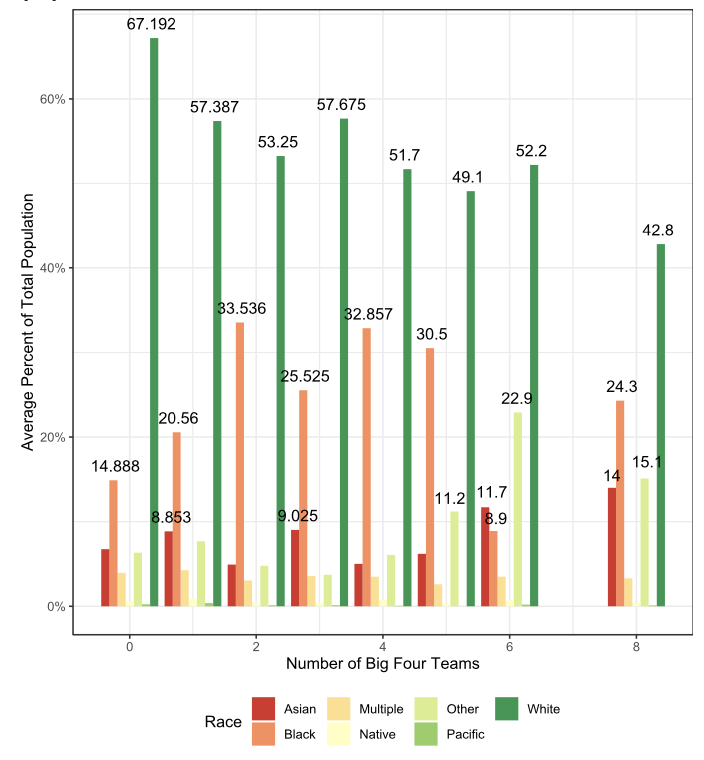
When exploring city demographics, specifically race, it quickly became apparent that cities with teams are more diverse than those without teams at these high levels of population.
By incorporating techniques such as logit modeling, I was able to form predictions for the likelihood a city would host a team in each of the Big Four leagues. I then further dove into why some cities or leagues had different projections for their teams. Down the road, using similar methods, I will attempt to model and predict attendance for these prospective cities.
Results
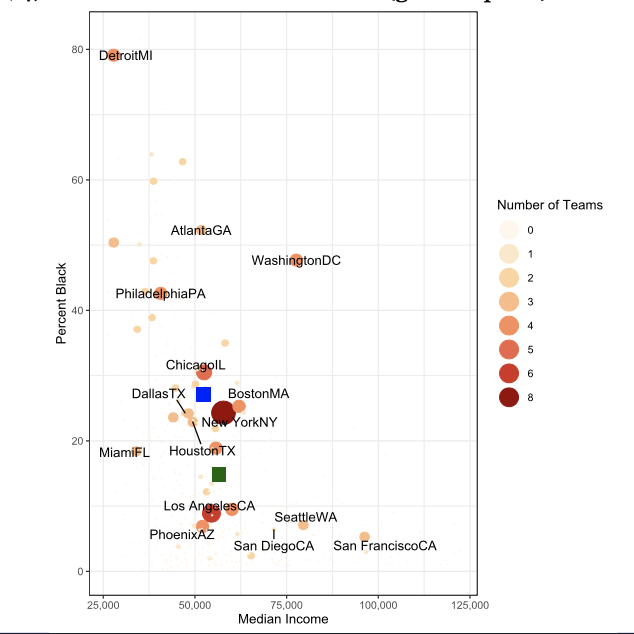
When comparing the relative black population to median income, cities with teams (blue square) have a higher black population by over 12% and lower median income by over $4,000 than those without teams (green square).
For each of the Big Four leagues, different factors led to higher projections in the likelihood there was a team in each city. For some leagues, factors such as race, the presence of other Big Four leagues in the respective city, or even the median age of the city had massive differences in the projections.
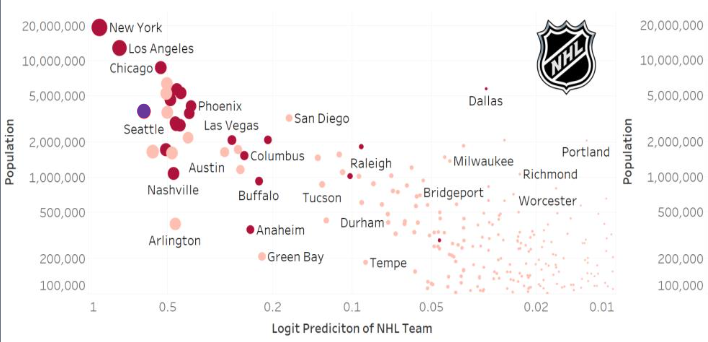
With the announcement of the NHL moving to Seattle, I was inspired to see whether the NHL made a good choice in making the city their thirty-second location. Based on my research, Seattle had the third highest probability of having an NHL city out of all US cities, highlighted in purple.
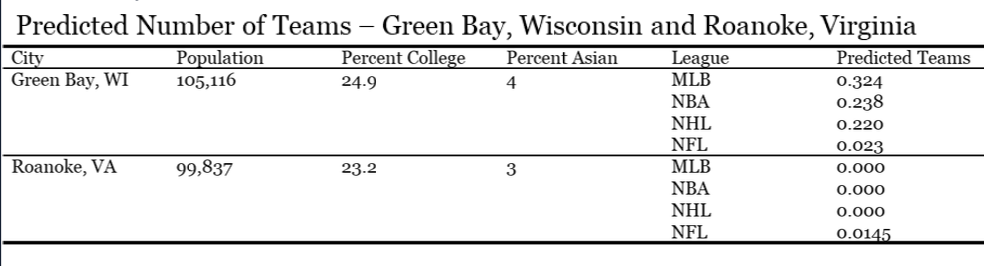
The results might have been a little heavily dependent on other teams in the city, however. The smallest sports city by population is Green Bay, Wisconsin, near the bottom of the population requirement. Home to the Green Bay Packers, my models think highly of the city and expect it to have teams in other leagues, too. When comparing Green Bay to a city with similar demographics like Roanoke, VA, it is easy to see why the Packers are such an influence on the city.
When exploring clustering methods, three main clusters appeared to be the best representations of the cities in the demographics dataset. Below is a table representing the mean values of three important factors for the clustering: median income, percent white, and percent black. These clusters can be further used for exploration of number of cities with teams in each cluster to determine which cluster has the highest likelihood of producing another city that could host a team. With over 60% of teams being in Cluster 1, it is easy to believe those criteria fit the demographic profile of sports cities in America.
| Cluster 1 | Cluster 2 | Cluster 3 | |
| Median Income | 42,243 | 90,503 | 54,107 |
| Percent White | 52.05 | 64.9 | 74.3 |
| Percent Black | 33.1 | 6.3 | 9.1 |
| Teams/Total Cities | 74/141 | 8/71 | 32/240 |
Conclusions
When researching the impact on demographics on attendance and the presence of teams, a few things jumped out as important. Race and income are massive factors for determining whether a city would be a good host to a team. Oakland, California has the second most teams relocate from it since 1950 with three, and also have a low median income for the county of $63,251. This low income as well as a high percent of the population who are Asian or Multiple races likely play a part in the city losing multiple NFL franchises. The purpose behind this poster is to understand why some cities are more successful in hosting professional sports than others even if they seem to be in similar situations and to explain trends in attendance over time, and further research that will be completed will help make this possible.
Acknowledgements
I would like to express my very great appreciation to Dr. Rodney Paul for his guidance in research and support throughout this entire process. I would like to thank Dr. Josh Introne for his guidance with data visualizations. I would also like offer special thanks to Dr. Justin Ehrlich for assisting me in scraping data from my data sources and to Kyle Liotta for generously giving me the demographic data. My special thanks are extended for Syracuse University for giving me the opportunity to do my own research and present it at prestigious events such as the Falk Student Research Celebration. Finally, I wish to thank my family for their support and encouragement through my entire academic career.