
By Nick Schloop – Syracuse University ’20
Abstract
The purpose of this research is to answer two main questions: who are the best NASCAR crew chiefs of the past 15 years and what specific influence do these individuals have on the race? Using a dataset from 2005-2019 a leaderboard of the best crew chiefs was created using a fixed effects linear model answering the first question. An aggregated version of the original data was used, and a RIFLE linear modeling technique found the quantifiable effects crew chiefs have on each race answering the second question. By quantifying the value a crew chief brings to the race and how valuable each one is individually their overall contribution to the race team can be more easily measured.
Introduction
There are an increasingly large number of elements that go into winning a championship across the realm of sports. This is no different in NASCAR; one of the most important aspects is leadership. Finding good “coaching” or leadership in terms of a race team leader and crew chief is essential to success. A lot of adjustments and changes occur throughout a race and race season, and the crew chief is the main decision maker. Finding the best crew chief possible is always on the mind of all race team owners and streamlining this process could create future success.
Another element of all race teams is cost optimization. Running a race team is increasingly expensive from week to week, totaling close to $500,0001, so having success in races is vital to maintaining profits. Holding a profit through on track success is directly tied to both the driver, team, and crew chief. So, finding the best possible crew chief allows better on track success which also increases profits off the track too. Quantifying what a crew chief brings is a way to see their value added in a simpler context and target the one who will bring the most consistent success. Also, finding out the ways in which a crew chief influences a race can help everyone as well. Targeting an analysis on this could also be helpful to all parties involved.
Method
The first model is a solution to the first research question of who the best NASCAR crew chiefs from the past 15 seasons are. A linear model with fixed effects was used with the dependent variable as driver rating. Driver rating is an all-encompassing statistic that when averaged over the course of a season shows who the best drivers are on the racetrack. The independent variables included a few different statistics, like laps led and percentage of laps within the top 15 positions, but most importantly each driver, owner/race team, and qualified crew chief. For a crew chief to qualify in the data, he had to take part in at least 36 races, or a full-length season. By including both drivers and crew chiefs on the right side, the direct effect on the driver rating is shown for each individual driver and crew chief. This value can be ranked, and this ranking created the basis of the crew chief leaderboard seen below. Their coefficient value shows the positive or negative gain they bring to the constant value of the driver rating. Having a positive effect on this value shows the consistency the crew chief’s leadership brings to the race and the best crew chiefs will have the largest effect on the driver rating.
The second set of models provides a solution to the second research question of what influence a crew chief has directly on a race. A linear modeling technique was used called the RIFLE2 or Randomized Inference for Leader Effects. The data used to run the model was first demeaned and lagged to gain statistical precision in the calculations. The dependent variable is the list of qualified crew chiefs and the independent variable is a statistic of interest such as laps led or green flag passes. After finding the r-squared of the original dataset, the crew chiefs were randomized then the model is run again. This process is done 1,000 times per each statistic and an average r-squared value is found. The difference between this average r-squared value and the original r-squared value can be the effect that the crew chief has on that proportion of the race. A test was done to make sure an effect was found and the p-value in the table to the right shows by not being significant there is an effect in every case. The percentage effect that the crew chief has on that portion of the race is a proportion of the difference over the original r-squared value. Finding this number is the answer to the question of how the crew chief affects the race and the RIFLE model finds this answer.
Results
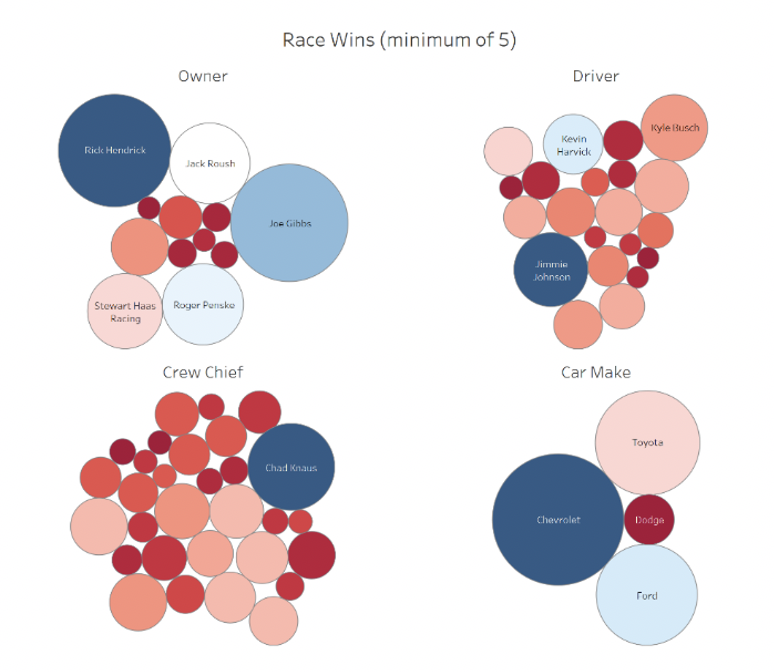
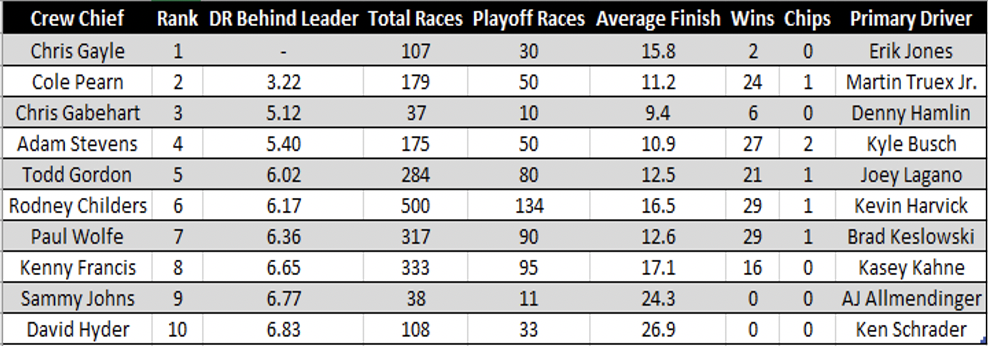
The first model was created to find who the best crew chiefs have been in the past 15 years. The leaderboard to the left shows the results of this model. Chris Gayle when holding everything else constant has a driver rating of 111.398, the highest of any of the qualified crew chiefs. His coefficient value of 5.396 means being roughly 5.4 driver rating points above the replacement level crew chief. This coefficient can be combined with a driver’s coefficient to show the estimated rating point increase together. For example, Chris Gayle’s primary driver is Erik Jones and his coefficient value in the model is -7.838, meaning he is quite below average. However, when they run races together their combined rating difference is -2.442 much closer to the average pairing. Based on this principle, Gayle can boost Jones’ ability on the track and Jones would not have won 2 races or have as high an average finish with an average crew chief. This combination of crew chief and driver could also be brought to the race team level. For example, the top 4 crew chiefs are all on Joe Gibbs Racing and so are their drivers. This allows them to easily move between pairings if it brings benefit to individuals within the situation and the team. For example, if Gayle, the best crew chief, were to be paired with the best driver, Kyle Busch, they would most likely produce better results then either of their current combinations while helping the race team too.
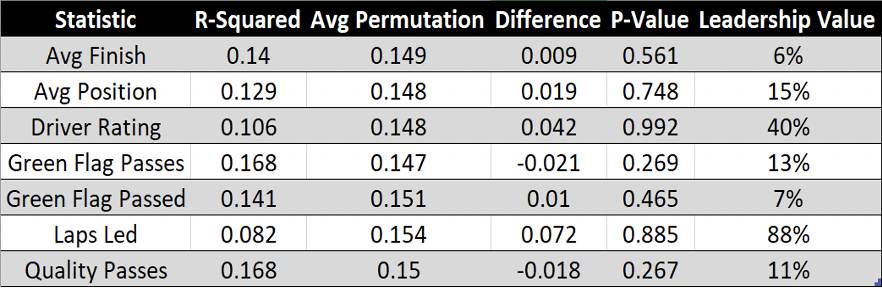
The second set of models finds how much of an effect that the crew chief has on each of the portions of the race above. The leadership value column shows the proportional effect that the crew chief has on each of the statistics. The laps led value is incredibly high at 88% giving a lot of the direct impact of leading laps to the crew chief. However, the best crew chiefs are ones who win the most races and run the race from the front of the pack. This can also be attributed to the strategy element led by the crew chief. For example, some crew chiefs push their drivers to the front of the pack being aggressive while others are more conservative which is a key to leading laps or not. The second highest value at 40% is on driver rating. Crew chiefs affect all aspects of the race including all the statistics weighted into the driver rating. Because of this, it makes sense that they have a large influence on having a high driver rating for their drivers and the combination of them both together. Also, their impact on driver rating ties directly to the first model’s findings too because it quantifies each individual crew chief’s value in terms of this impact. Some have big positive impacts like Chris Gayle while others have large negative impacts but, in both instances, they have an effect.
Conclusions
The two distinct models were able to answer the question posed at the start of the research. The fixed effects model created a leaderboard of crew chiefs and the RIFLE method shows the impacts that the crew chiefs have whether positive or negative. Holistically, some conclusions can be found about the analyzes too. It seems that some race teams have done some internal analysis of their own.
Joe Gibbs Racing is at the pinnacle of the sport of NASCAR currently employing 3 of the last 5 NASCAR champion drivers as well as the top 4 crew chiefs according to the model. They saw the positive effects of Cole Pearn on Martin Truex Jr. and their success on the track, signing them away from their previous team at the start of the 2018 season. Internally, their pairings are all currently optimized too creating the best individual value as well as the best value for the race team too. Besides at the race team level, the ideal crew chief can also be designed too from the results.
A crew chief who brings the most value according to both portions of analysis includes a few distinct traits including being aggressive, pushing to race at the front of the pack, and being consistent across the entire season in terms of strategy. A crew chief who can do this throughout an entire season will bring the most value to their driver, car, and race team producing the best possible results for everyone involved.
References
- Coble, Don. “Pit Road to Money Pit: Costs to Field a NASCAR Team Are Staggering.” The Florida Times-Union, The Florida Times-Union, 16 Feb. 2012, www.jacksonville.com/article/20120216/SPORTS/801257725.
- Berry, Christopher R, and Anthony R Fowler. “Leadership or Luck? Randomization Inference for Leader Effects (RIFLE) .” Leadership or Luck? Randomization Inference for Leader Effects (RIFLE) , August 8, 2017.
Acknowledgements
I would like to thank Dr. Rodney Paul, Dr. Jeremy Losak and all the Sport Analytics department for their help and support throughout the process of developing and writing my thesis.