
Imagine the insights you could uncover by having every jump, swing, pivot and sprint captured and transformed into precise data. That’s exactly what students in the sport analytics program are doing, through a partnership established in 2022 between the Syracuse University Department of Athletics and the David B. Falk College of Sport and Human Dynamics. By revealing a deeper understanding of performance and potential, students collaborate with Orange coaching and training staff to deliver data-driven insights gathered through a combination of wearable technologies and good old stats-keeping.
“For the teams that have embedded these students into their programs, it’s worked out very well. They’ve been able to get insights that have led to a lot of success,” says sport management professor Rodney Paul, director of the sport analytics program. “That’s opened up doors for not just those students, but all the students who follow.”
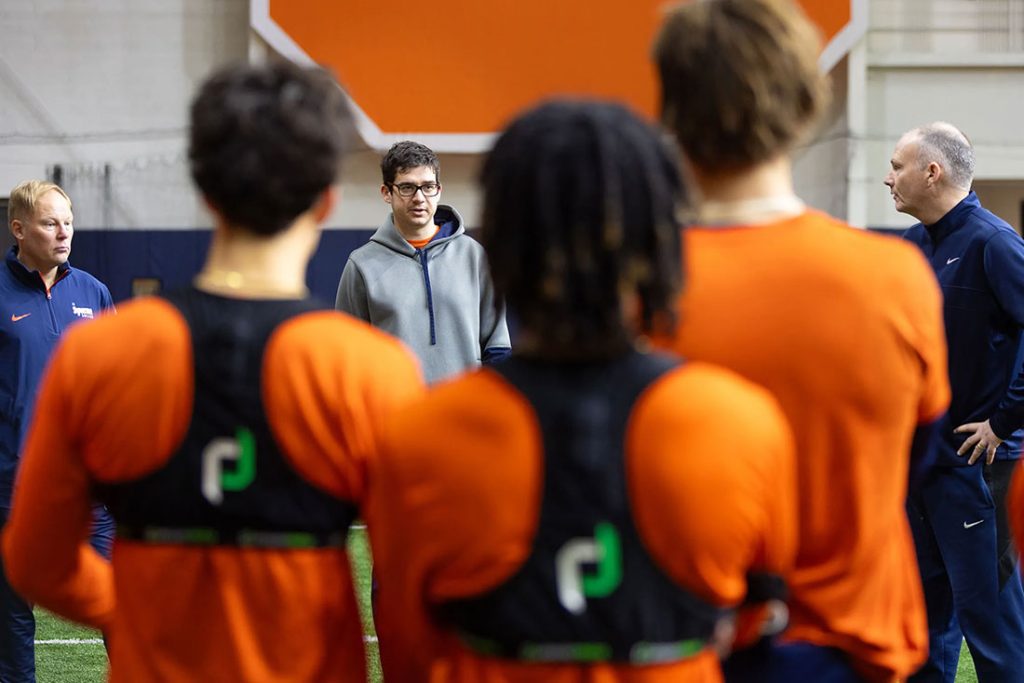
The partnership originally started with the men’s soccer team, and head coach Ian McIntyre considers the sport analytics team an integral part of the program. “They played a very important role in helping us secure a national championship in 2022,” McIntyre says. “Our analytics team wonderfully complements our coaching staff to help create the best possible training environment for our players and allows our program to compete at the very highest national level.”
The program now includes 11 teams, with students contributing to performance analysis based on each team’s needs. “We created an internship program to add value by helping teams analyze their data in meaningful ways,” says sport analytics program manager Francesco Riverso.
Students gain practical experience, refine their skills and pass on their knowledge to new interns, creating a cycle of continuous improvement. “We don’t rebuild—we reload,” Paul says.
Tracking Movement for Real-Time Insights
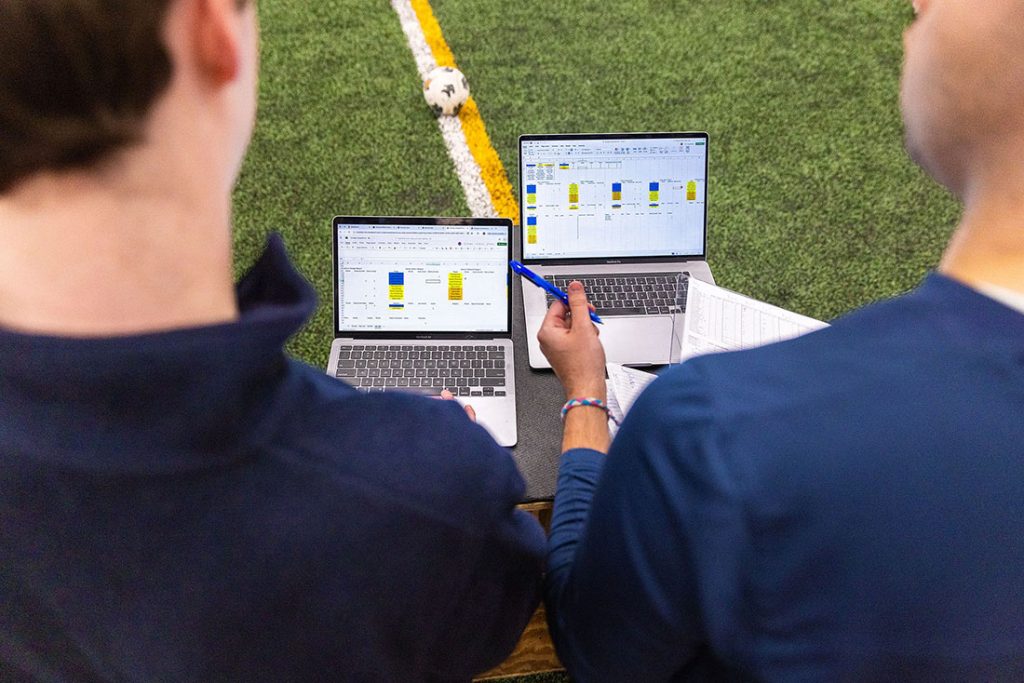
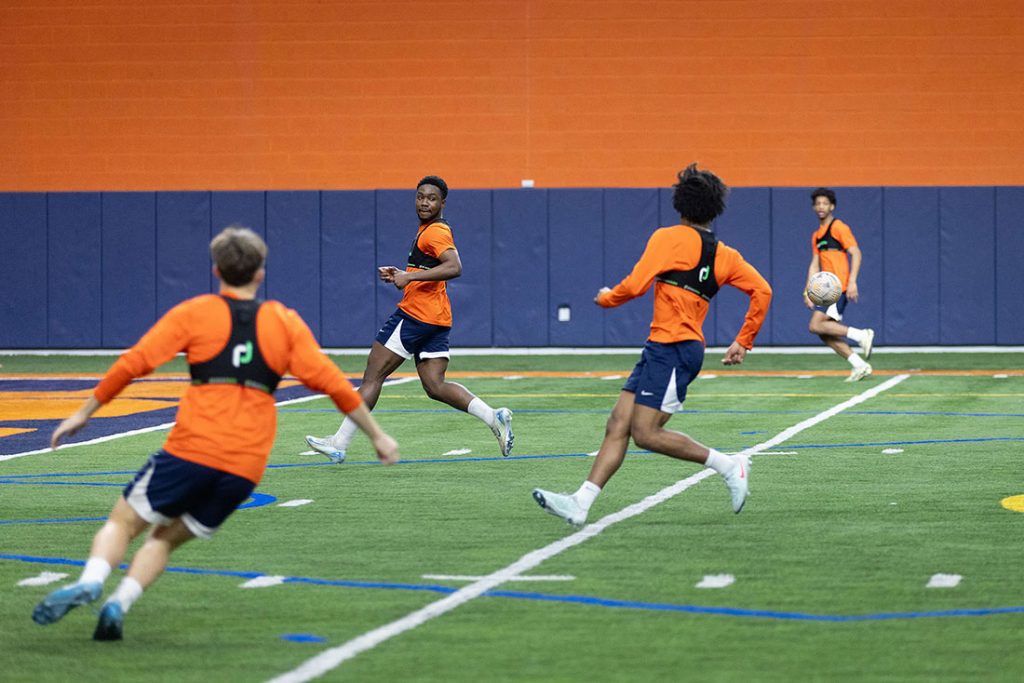
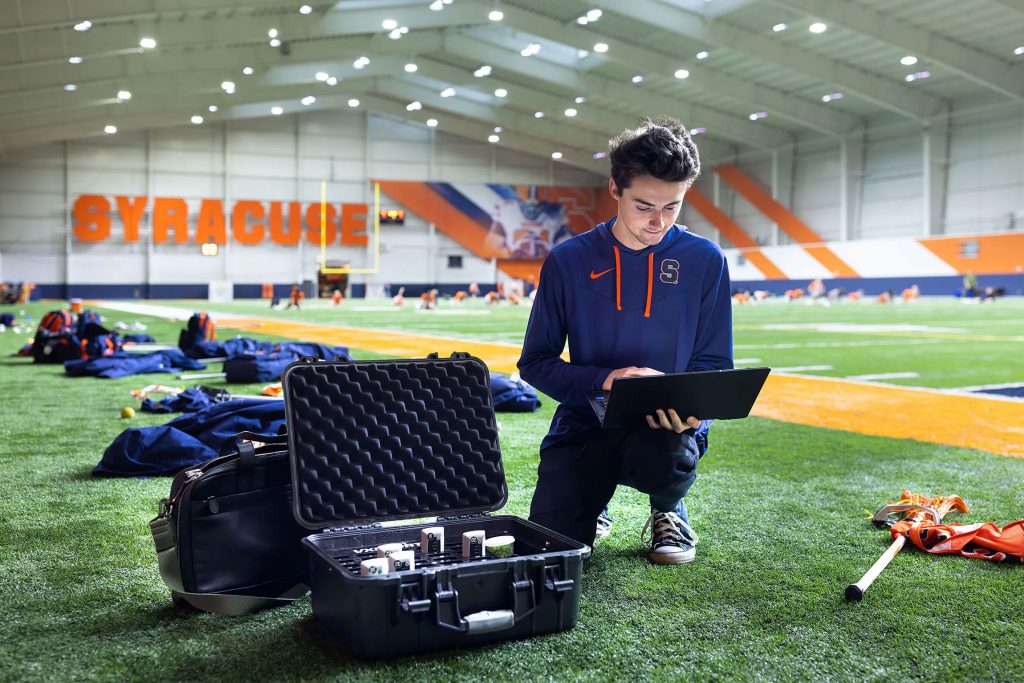
When the Orange men’s soccer players take to the pitch, they’re outfitted in PlayerData vests with GPS trackers that provide real-time data on their movements. The sport analytics interns track and analyze metrics like total running distance, acceleration, deceleration, sprint distances, how often players speed up or slow down. The students generate heat maps that reveal player positioning during a match and have created two apps that allow them to organize their information into data visualizations. “We can transform the raw data in a way that allows the coaches to see it easily and gain insights,” says lead analyst Nick Rovelli ’24, G’25, a sport analytics graduate who has worked with the soccer team since 2022 and is now an applied data science graduate student.
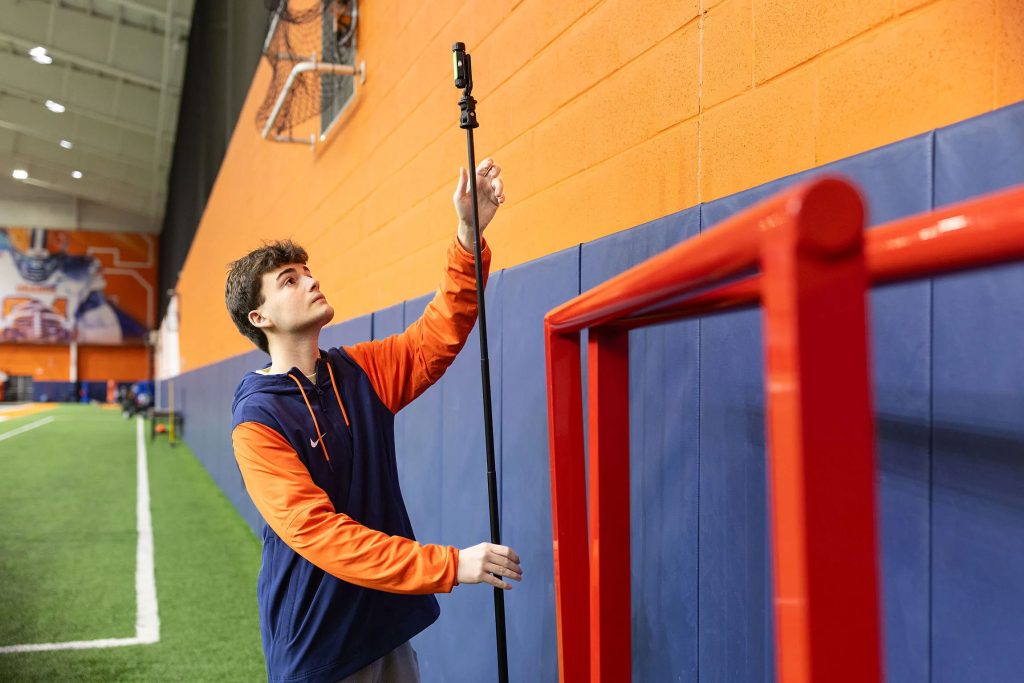
During home games, Rovelli is on the sidelines while analyst Theo Schmidt ’26 sits in the stands, collecting data that he feeds to Rovelli, who communicates with the coaches. “It’s definitely high pressure, so there’s some growing pains,” Rovelli says. “But the coaches have been great at giving us positive feedback and are always encouraging us to do more.”
Even during away games, the analytics team watches matches on the ACC Network and ESPN+ to gather stats, view player data and communicate with coaches. They also create scouting reports, as well as pre- and postgame analyses. Next season, they plan to use Wyscout, a platform that offers video analysis tools and a comprehensive database of teams. “The program is a great opportunity—a win-win, both for the department and the students,” says Schmidt, who joined the team in 2023. “We’ve had to build so many tools. It allows us to experiment with different applications and really take advantage of the coaches’ willingness to let us learn.”
Monitoring Player Workloads
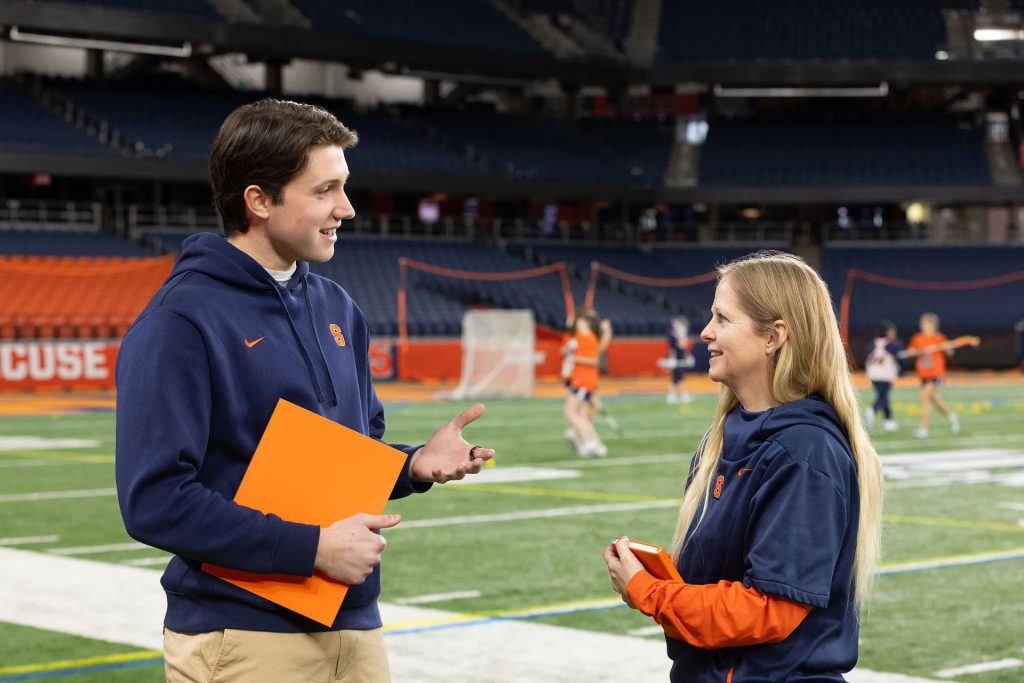
Women’s lacrosse analytics interns Caden Lippie ’25 and Ryan Severe ’25 will admit they didn’t know much about lacrosse before they began working with the team in 2022-23. But since then, they’ve helped monitor player performance through the VX Sport system, a wearable GPS technology that tracks the players’ movements in real time. “Working in a program for this extended amount of time is unique,” Lippie says. “You get a different perspective working with a small staff, which is a good experience.”
The data—including live metrics on game days—helps the coaching, training and conditioning staffs manage player loads and minimize injuries. “We can work someone back into practice from a recovery or injury standpoint,” says assistant strength and conditioning coach Mike Sullivan. “It helps us plan for the future in a safe manner so we can try to keep everyone healthy and minimize any risks of overloading them.”
Lippie and Severe upload data after practices and games into Microsoft Power BI, a software system that allows them to produce visualizations and reports. Lippie worked with associate athletic trainer Kat Chaney to incorporate a daily wellness survey the players take before practice into a dashboard with the GPS data. “It’s awesome for us to have a snapshot of each student-athlete on the team, of all their metrics we’re collecting and how the team is feeling on the whole,” Chaney says. “Caden’s information is helping us on a daily basis improve our communication with the student-athletes.”
Lippie and Severe both appreciate the opportunity to work with different technologies, especially as their use becomes more prevalent among college and pro teams. “It’s been a super valuable experience that could help us in our professional careers,” Severe says. “Learning the technologies that a lot of teams use and interacting with DI lacrosse coaches has been such an amazing experience.”
Capturing Pitching and Hitting Data
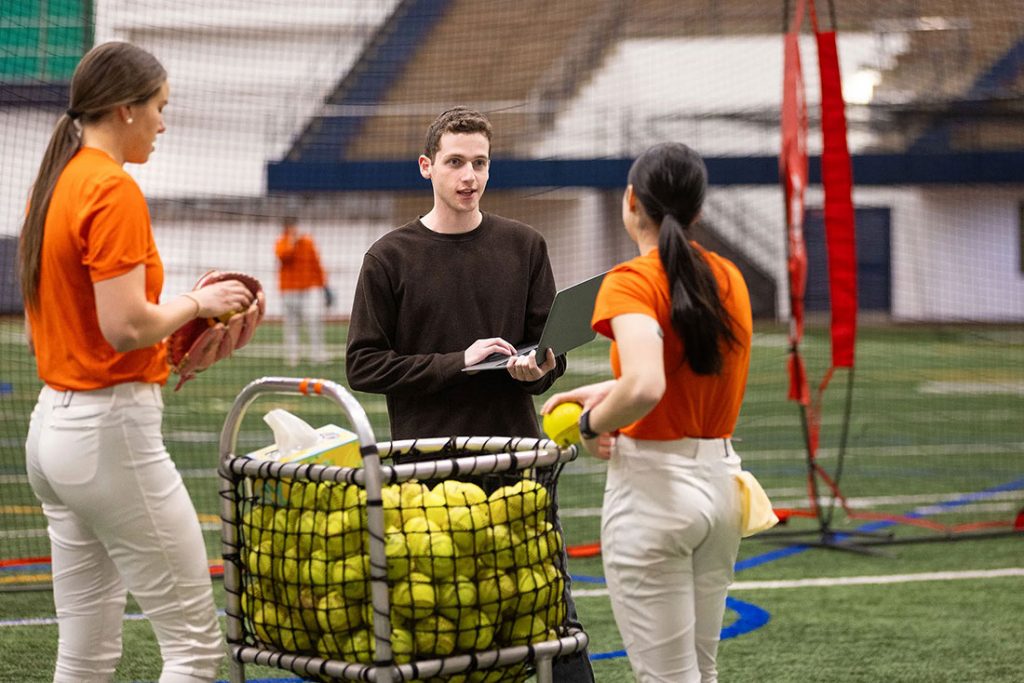
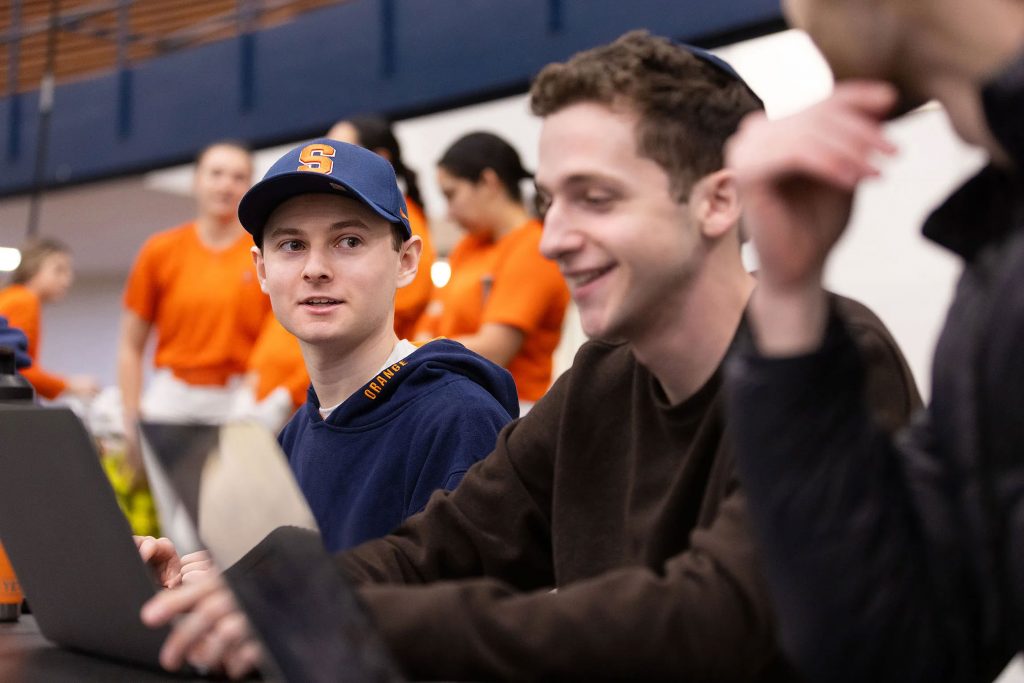
At Orange softball team practices early this semester, Gavi Sela ’26 and Andrew Diamond ’27 parked themselves behind the catchers to track pitches and hitting during batting sessions. “In the long run working with sports data, particularly in baseball or softball, will help my analytical skills, looking at all aspects of the data and being able to break it down, analyze it and look at the tendencies that a player or teams may have,” says Sela, lead analyst for the eight-member analytics team that launched a partnership with the softball team last fall.
From there, they log the location and outcome of the pitch as well as the kind of contact the batter makes. They feed the data into a spreadsheet and analyze it, helping to determine which pitches were successful and what batters were swinging or not swinging at. “The goal ultimately is to provide accurate insights to the coaching staff that can help the team improve its performance,” Diamond says.
Softball head coach Shannon Doepking says the analytics team “has already made an incredible impact on our program,” citing their work building out charts that help develop better hitting and pitching plans as well as in-depth scouting reports. “I’m excited for the future with this team and truly believe they will help us achieve goals that we have had with their help in true development of our student-athletes,” Doepking says.
As the softball season progresses, the analytics team hopes to work with other technologies, including Rapsodo, which tracks hitting and pitching data, and Synergy, a scouting platform that features opposing team statistics and game videos. They aim to build a foundation that will continue to grow the analytics program. While improving their analytical skills, they’re also developing interpersonal relationships with the team, learning from exchanges with coaches and players.
“Once we have a lot of data collected cleanly, we should be able to look into it at a deeper, more analytical level,” Diamond says. “Next year we’ll all be back and have a good feel for how everything works out year-round with the team.”
Effectively Communicating Data
Last season, the Syracuse women’s soccer team transitioned to wearing PlayerData vests, which use the live data from GPS trackers to monitor player workload. “I’ve worked for the team for three years now and I’ve loved every second of it,” says lead analyst Ian MacMiller ’25.
MacMiller was joined on match days by several other analytics interns who collected statistics on a shared spreadsheet and produced visualizations for a presentation that MacMiller shared with the coaches. “The interns’ main responsibility during games is to track stats that we communicate to the coaching staff so they can make necessary adjustments,” MacMiller says.
Along with the wearable technology data, the student analysts track ball losses, crossing accuracy, ball receptions in the attacking half of the field and other statistics that are “helpful for coaches to know what the players could work on in practices and games,” says analyst Matt Liddell ’25, who worked with the team last fall. “I got great data collection experience, which will definitely be important for lots of entry-level jobs in data analytics. It was a great test of my multitasking skills as well, since at times I was in charge of two to three statistics.”
MacMiller created dashboards through Power BI, so coaches could view data after practices and matches. For MacMiller, the opportunity to work closely with the coaching staff, including learning how analytics can be used to minimize injury prevention, has been a welcomed benefit. “The experience has allowed me to learn how to effectively communicate data and how coaches apply that data to their game plans and training sessions,” he says.
A Syracuse University story by Jay Cox originally published on March 4, 2025.