
After students from the Sport Analytics program at Syracuse University captured back-to-back undergraduate team titles at the AXS National Collegiate Sports Analytics Championship in 2023-24, the program had just one more mountain to climb: An individual championship.
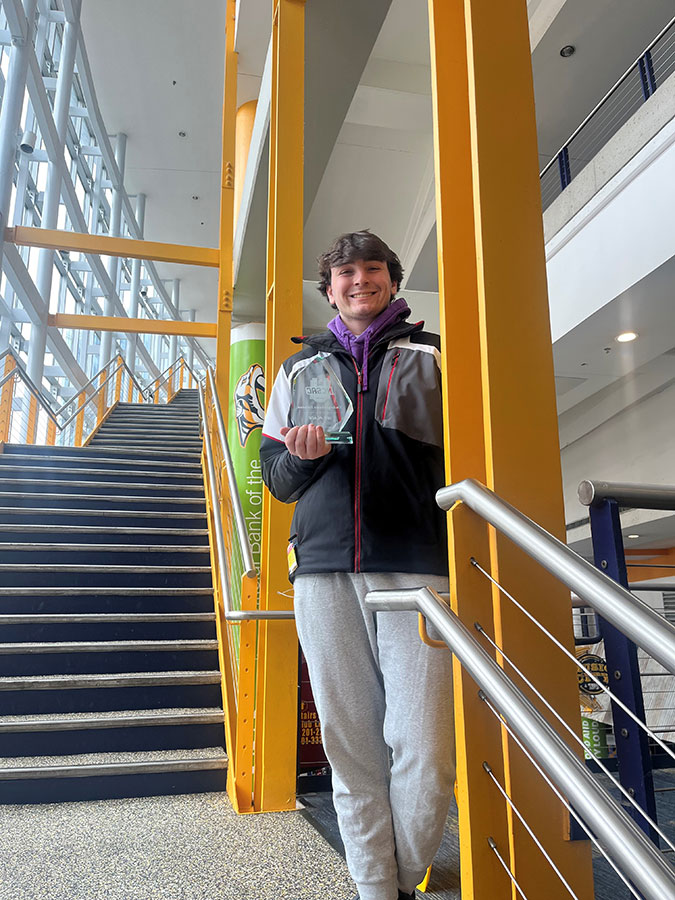
Late last month in Nashville, Tennessee, sport analytics major Jonah Soos ’25 reached that pinnacle by winning the championship in the undergraduate business analytics division.
“It was awesome,” Soos says. “Any time you can win a national event of this caliber against steep competition, it’s an incredibly validating feeling for the work you put in.
“I was so proud to represent Syracuse and the Sport Analytics program and all the time and effort they put in to cultivating the best rising talent in sports,” Soos adds. “I can’t give them enough credit for the work they’ve done and opportunities they’ve given me, so to give back and increase the exposure of the program is always something I enjoy doing.”
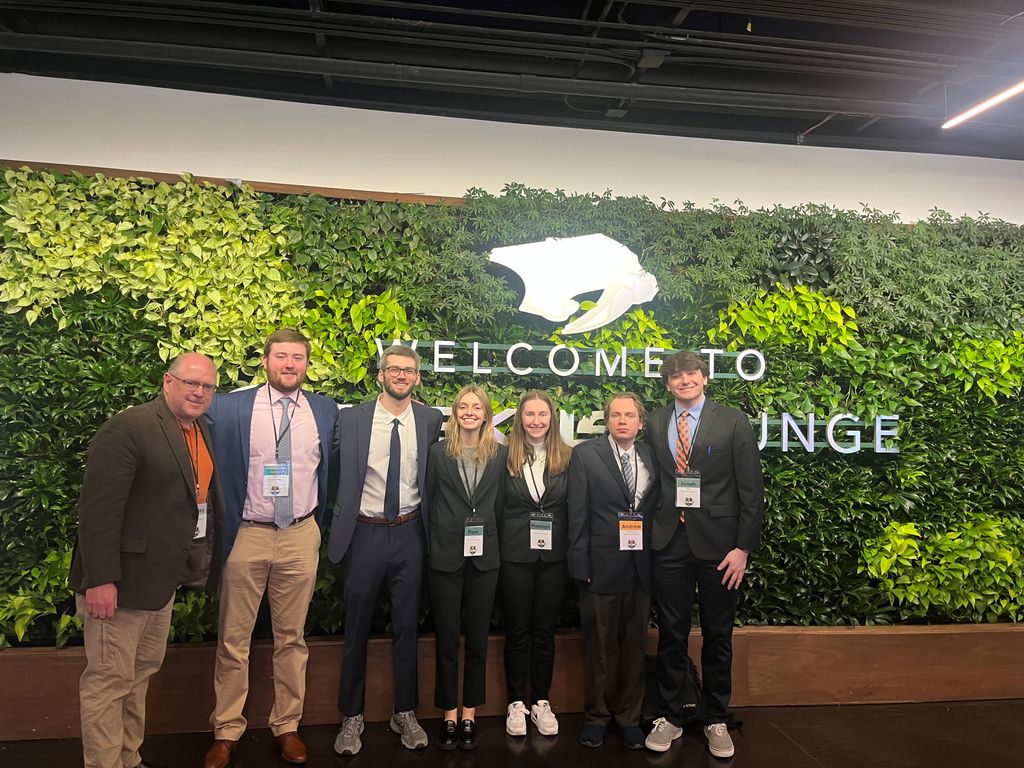
The Syracuse University undergraduate team of Soos, Piper Evans, Madelyn Forster, and Hunter Geise just missed a three-peat by finishing a narrow second to the team champions from the University of Iowa. Graduate analytics students Andrew Odnoralov and Owen B. Brown also participated in the competition for Syracuse.
Sport Analytics Undergraduate Director and Professor Rodney Paul and Sport Analytics Program Coordinator Jackie Dorchester accompanied the students to Nashville and mentored the group, and Soos praised Paul, Dorchester, and Director of Corporate Partnerships and External Engagement Francesco Riverso for “making opportunities like these a possibility.”
“Our group did an excellent job in a challenging and exciting event,” Paul says. “Jonah, as always, was incredible; calm and poised in the heat of competition. He’s truly a superstar as he makes it look so easy. You can almost see ‘the game’ slow down when you hear him present and see the literal art he creates with data. It is amazing to witness.
“We are so lucky to have a talent like Jonah in our program,” Paul says. “We’ll miss him after graduation, but I can’t wait to watch his career unfold.”
Soos, who is minoring in economics and sport management, has worked as a baseball analytics intern at Wasserman, a baseball talent agency, and he’s currently a data engineering intern for the Syracuse University men’s basketball team. This past August, after presenting his research on pitchers at the Saber Seminar in Chicago, Soos was approached by several Major League Baseball teams was hired by the Cincinnati Reds as a baseball analytics trainee for the 2025 season.
We reached out to Soos to learn more about his experience in Nashville and what it took to become a national champion. Here’s that conversation:
What was the format for the individual and team competitions at the National Championship?
It was set up in a March Madness-style bracket, starting with 64 students in 16 different rounds of four students, and two students advanced from each round. Points were awarded for teams for every round a student advanced and totaled over each section (undergraduate and graduate) once the competition concluded to create the team standings.
As students, we presented our five-minute presentations to a room of judges each round, and if selected in the top two, we moved on to face other students until a winner-take-all final four in front of the entire conference. The first day was used for data analysis and the heats, and the second day was for the final four and a networking challenge.
What was your “assignment,” and were you given any advance notice of what you would be doing?
Our assignment was analyzing PWHL (Professional Women’s Hockey League) social media data provided by Zoomph to create analytical insights about ways the brand can continue to grow and expand. We were provided sample data and a study guide ahead of time to think through the question and understand the data. Most questions on the study guide were very broad and built to give a lot of flexibility for interpretation and analysis, leading to the true assignment of creatively interpreting the data to find critical data-driven insights.
What was your reaction when you received your assignment?
I definitely felt like the competition played into my strengths. My favorite part of data analysis is the storytelling component–placing data in context to find actionable insights and key takeaways that anyone can understand. In this format with quick presentations and limited time, you really have to be at your best and cut the fluff, only giving judges quick hitters to make a cohesive story.
Can you explain what kind of data you received, what you needed to analyze, and how you went about that?
We received data from different social media platforms for each PWHL team tracking post reach, engagement, and platform-specific effects. We were given roughly four hours to create the data-driven insights and build a presentation before everything was locked and no changes could be made.
That sounds nerve-wracking. What was your strategy under such a tight deadline?
When looking at the practice information, I was lacking some direction and only prepped different functions to clean the data and get it into a usable format. At 6 a.m. on the morning of the competition, I had an idea almost slap me in the face: It was super simple but innovative and I knew I could tell a compelling story. I don’t know a lot about hockey, so I placed myself in the shoes of the PWHL social media managers and asked how I would engage myself. Considering I would be new to the brand, if the post reached a lot of people like me, and I interacted or engaged with the post, I would deem that as the most successful since you’re broadening your fanbase while also generating active fans.
I entered looking to build something to fit that narrative and took the four hours to execute it, and found some interesting results. The hardest part was probably the time constraint itself, as when you’re working through a problem like this, it’s hard to manage your time effectively and execute all your ideas in such a short window. I found myself constantly pushing my own boundaries to work quick and thorough, having to focus to overcome different errors, challenges, and kinks in my analysis. Finishing the project was a win in itself, and when I looked back and saw the visual and analytical quality I generated, I was proud of myself! I felt I set myself up for success.
How was the data judged and how was it determined that you were the champion of the undergraduate division?
Each round, you would give your five-minute presentation to judges (more judges each round as you progressed), answer some questions, and wait outside as each competitor did the same. It was grueling–you had no idea whether you were scraping by in the hot seat or flying through–but there was a fun sense of camaraderie between all of the competitors, and I made some really awesome connections with people.
The first round was definitely the hardest; you had never given your presentation before and had very little prep time, so I was definitely the most nervous walking out of that presentation. As the rounds went on, I was in a flow state and felt every time my presentation got stronger and stronger up until the finals. The final round, unlike the previous ones, was a winner-take-all from the four students that advanced through the elite eight. That was the first real chance to size up your competition, see what everyone had done, and I was impressed with how vastly different each presentation was despite having the same data and objectives. Judges then voted on the order of the final four presentations, and I was fortunate enough to be crowned champion.
From your experiences at Syracuse University and Falk College, what is it about the program that prepares you to have this kind of success at the national level?
The Sport Analytics program is revolutionizing education in sport. To have the opportunity to so frequently interact with alumni in the industry, learn using real world data, and practice and compete against peers to build a collective wealth of knowledge, it’s what leads us to win all these competitions. I’ve learned so much from everyone around me–my peers, mentors, professors, and industry professionals–and without that experience, there is no way I would be where I am.
To learn more academic programs, experiential learning, and career opportunities in sport analytics, visit the Falk College Department of Sport Management website.